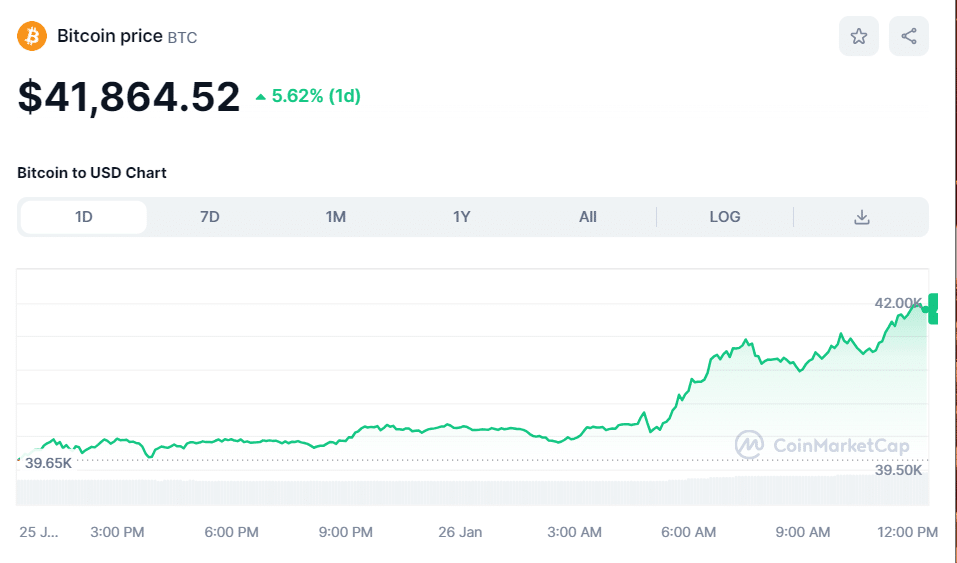
The Bitcoin (BTC) price is enjoying an end-of-week relief rally in wake of economic data that showed inflationary pressures in the US continued to subside to more acceptable levels in December 2023.
US Core PCE Price Index figures showed YoY inflation falling to 2.9%, below the expected rate of 3.0%.
The Bitcoin price was last probing $42,000, up over 5% in the past 24 hours as per CoinMarketCap.

The Core PCE Price Index is the US Federal Reserve’s favored measure of underlying price pressures in the USA.
With inflation in the US trending lower, this opens the door for rate cuts from the Fed this year.
Lower interest rates create a more favorable liquidity environment that can support crypto prices.
That could go some way in explaining why the Bitcoin price has pushed higher since Friday’s US market open.
US Equity Market Rally, ETF Flows Pushing Bitcoin Price Higher?
As per the CME’s Fed Watch tool, US interest rate future market pricing implies a probability of just under 50% that the Fed starts cutting interest rates as soon as March, unchanged from one week ago.
That suggests that, in wake of the latest US inflation figures, macro traders aren’t substantially upping Fed rate cut bets.
That view is further substantiated by looking across traditional asset markets.
The US Dollar Index (DXY) is flat and relatively unchanged on the week in the mid-103s.
The US 10-year yield is flat and relatively unchanged on the week around 4.14%.
If the narrative in traditional asset markets was a build-up of Fed rate cut expectations, one would expect both to be falling.
The Bitcoin price could be enjoying tailwinds from US stock prices.
The S&P 500 continues to press to fresh record levels and is now above 4,900.
Positive equity market risk appetite could be spilling over to crypto markets.
Grayscale sales of BTC from its GBTC ETF also appear to have slowed.
The last few days have seen Grayscale move 10,000 BTC per day to be sold on exchanges.
Meanwhile, newly launched ETFs from the likes of BlackRock and other asset managers continue to attract substantial flows.
Indeed, BlackRock’s iShares Bitcoin Trust (IBIT) surpassed $2 billion in assets under management on Friday.
JP Morgan argued earlier in the week that sell pressure from Grayscale’s GBTC is “largely behind us” – traders had been buying GBTC throughout 2023 at a discount to net asset value (NAV) on the assumption that it would be converted to a spot ETF, and that GBTC shares would then be directly redeemable for Bitcoin at net asset value.
Traders had been taking profit on this successful trade on masse in wake of GBTC’s conversion to a spot Bitcoin ETF earlier this month.
But JP Morgan thinks focus now switches to newly launched ETFs like BlackRock’s IBIT.
Assuming flows into such funds remain strong, this could underpin the Bitcoin price going forward.
How High Can the BTC Go?
Despite the latest rebound, the Bitcoin price remains around 15% down from its recent highs above $49,000.
The latest bounce suggests the 100DMA and November highs around $38,000 both acted as strong support.
But the Bitcoin price may have problems breaking back above its 21 and 50DMAs near $43,000.
Only once Bitcoin is able to break back above its 21 and 50DMAs on a sustained basis could we declare that market momentum has swung decisively bullish once again.
In this case, a retest of yearly highs around $49,000 would be on the cards.
In the months ahead, focus will increasingly shift to the Bitcoin halving and Fed rate cuts.
The latter has historically been an important long-term bullish catalyst for the Bitcoin price.
Fed rate cuts have also historically boosted BTC.
A retest of all-time highs at $69,000 remain on the cards for 2024.
