Major cryptocurrency exchanges have been experiencing net negative BTC flows into their Bitcoin wallets over the last few days, according to on-chain data presented by crypto analytics firm Glassnode.
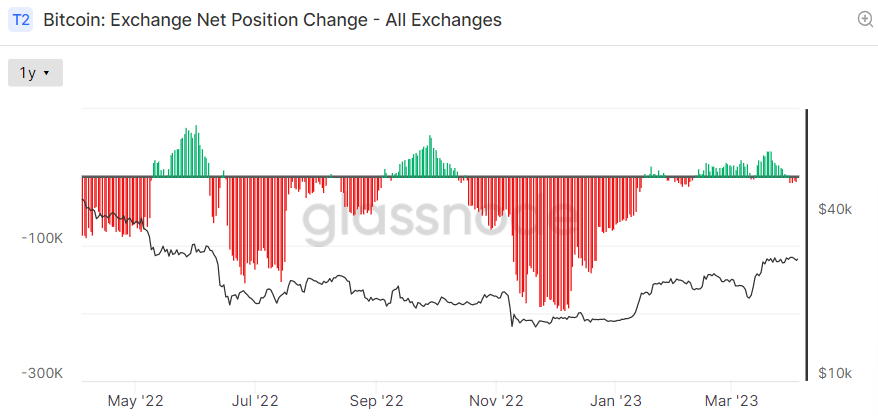
Flows into exchange wallets had been mostly positive since mid-February and the reversal could be a sign that sentiment in the Bitcoin market is improving.
That’s because investors/traders tend to move their Bitcoin to exchange wallets when they want to sell (resulting in net inflows to exchanges), while moving their BTC off of exchanges when they want to HODL.
Net exchange flows have a weak correlation to price performance, but some are nonetheless interpreting the recent shift in flows as another warning sign that the Bitcoin price is on the verge of vaulting above $30,000.
Bitcoin was last changing hands close to $28,000 on major exchanges, up around 70% on the year.
Is Bitcoin About to Vault Above $30,000?
Bitcoin analysts have many other arguments as to why they think the BTC price might soon see its next leg higher to take out $30,000.
Beginning with macro tailwinds, the main driver of the price rise last month – concerns remain about a possible bank crisis in the US (and globally), which continues to underpin Bitcoin demand as a potential safe haven.
Meanwhile, a spate of weaker-than-expected US data releases out so far on the week (the manufacturing and services ISM reports, JOLTs Jobs Data and ADP National Employment figures) have weighed on the US dollar and US yields by pumping bets for a US recession later this year.
This has resulted in markets further pulling back their bets for anything further Fed tightening – according to the CME’s Fed Watch Tool, money markets imply just a 44% chance that the Fed goes ahead with one more hike next month.
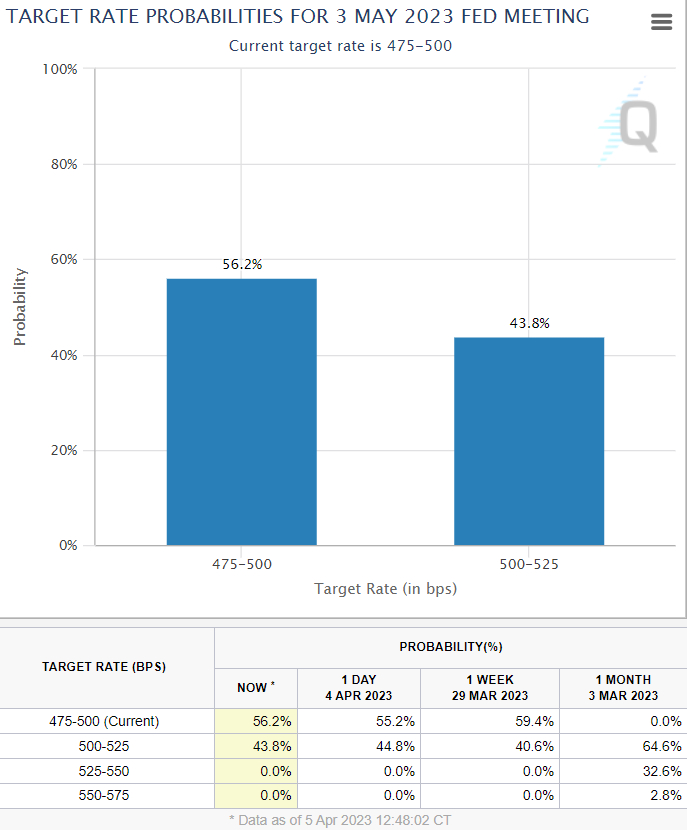
Moreover, money markets continue to bet on a rate-cutting cycle to begin in the second half of the year.
A weaker dollar, lower yields and bets on a more dovish Fed have historically boosted crypto prices.
Macro looks set to remain a major Bitcoin tailwind, so long as upcoming US data (like Friday’s jobs report) doesn’t push back against the US recession narrative and the bank situation remains sensitive.
Bitcoin Network Showing Signs of Strength
At the same time as the macro environment turns more favorable for Bitcoin, its underlying network is showing signs of strength.
According to Glassnode, the 7-Day Moving Average Number of Daily Active Addresses recently jumped to its highest level in nearly one year of over 1 million.
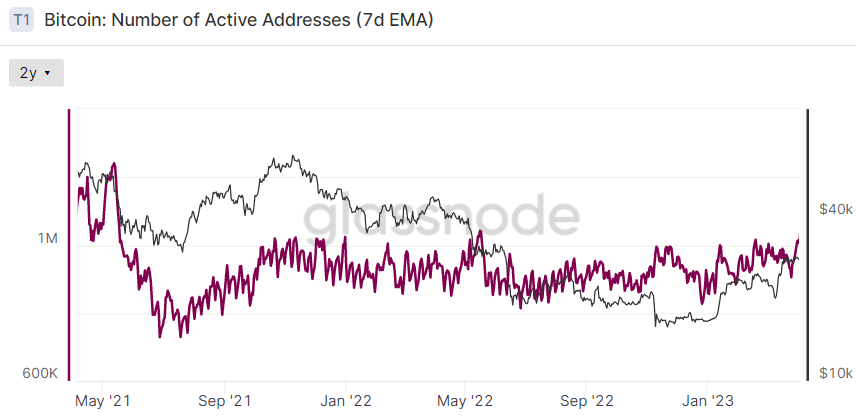
The 7-Day Moving Average Number of New Addresses is close to its highest level since May 2021.
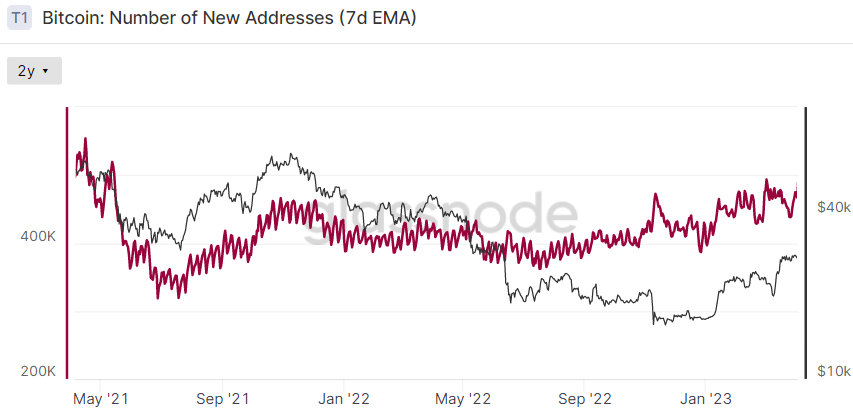
Meanwhile, the 7-Day Moving Average Number of Daily Transactions just jumped to its highest level since early 2021 of nearly 350,000.
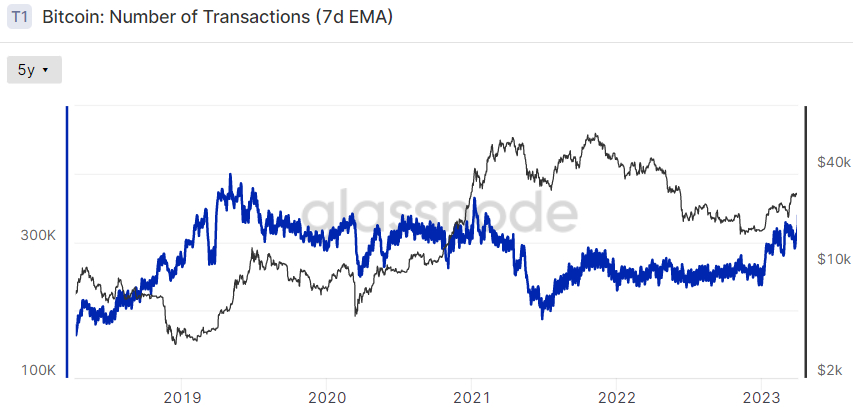
Strength in Bitcoin network activity suggests more people are using the network, suggesting more demand and a higher value for Bitcoin.
Where Next for the BTC Price?
Bitcoin’s near-term technical picture is looking a little mixed. The cryptocurrency is trading strongly above all of its major moving averages still, with the 21DMA recently offering good support.
Its 14-Day Relative Strength Index is also not in overbought territory, suggesting there is room for upside to occur without an elevated risk of profit-taking getting in the way.
However, things could go either way for BTC, given price action has formed into a pennant structure in recent days that could break out in either direction.
Whilst the above-noted fundamentals and on-chain factors suggest further upside is possible, Bitcoin’s price has been seeing bearish divergence with its RSI, which some take as a bearish sign.
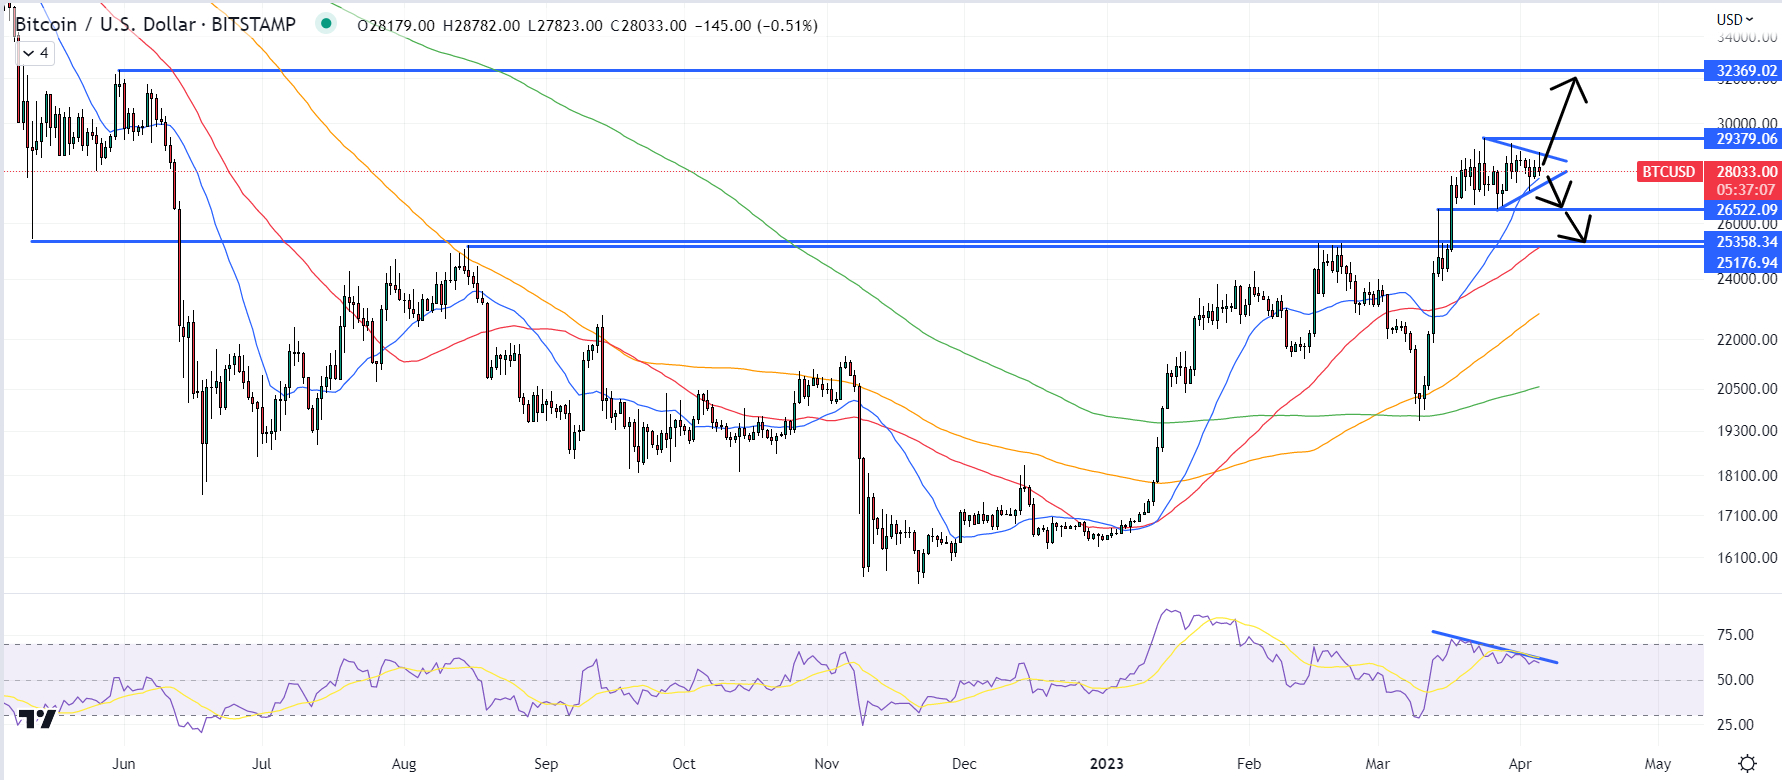
A downside breakout would open the door to the possibility of a swift retest of resistance-turned-support in the $26,500 area and possibly of the key $25,500 support zone below that, which coincides with the 50DMA.
But Expect Dip Buyer Demand to Remain Strong
In the current market environment, however, expect any such dips to attract significant demand.
Bitcoin’s recent strong bounce from its 200DMA (and Realized Price) under $20,000 and the “golden cross” seen in early February are very bullish long-term technical signs for the cryptocurrency.
Meanwhile, various longer-term focused on-chain indicators, such as those grouped in Glassnode’s “Recovering from a Bitcoin Bear” dashboard, are all flashing signals that a new bull market is here.
Analysis of Bitcoin’s longer-term market cycles also suggests a new Bitcoin bull market is here.
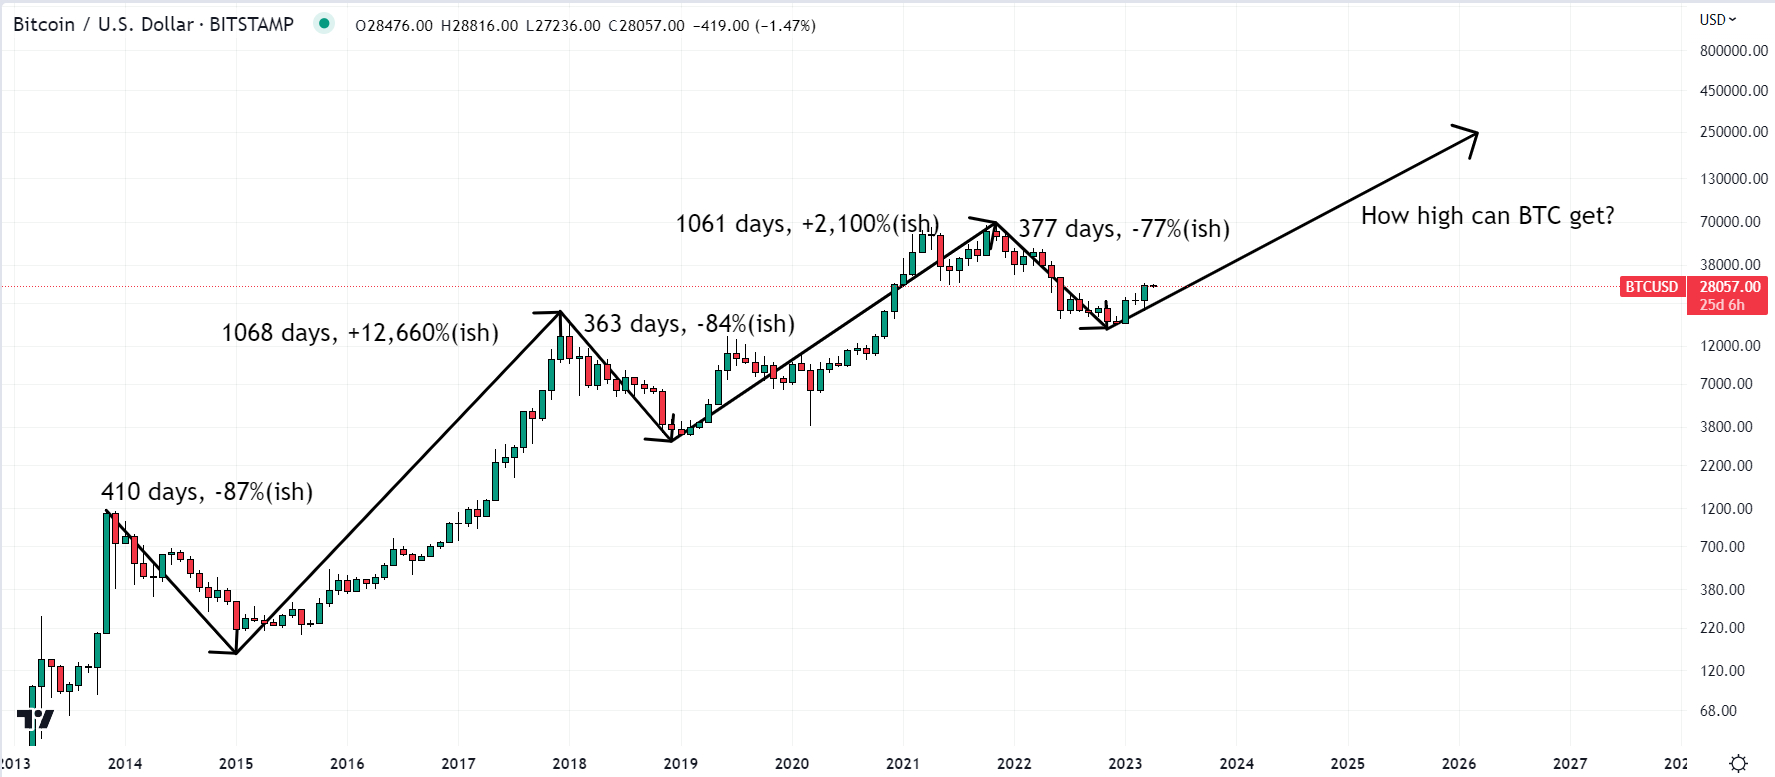
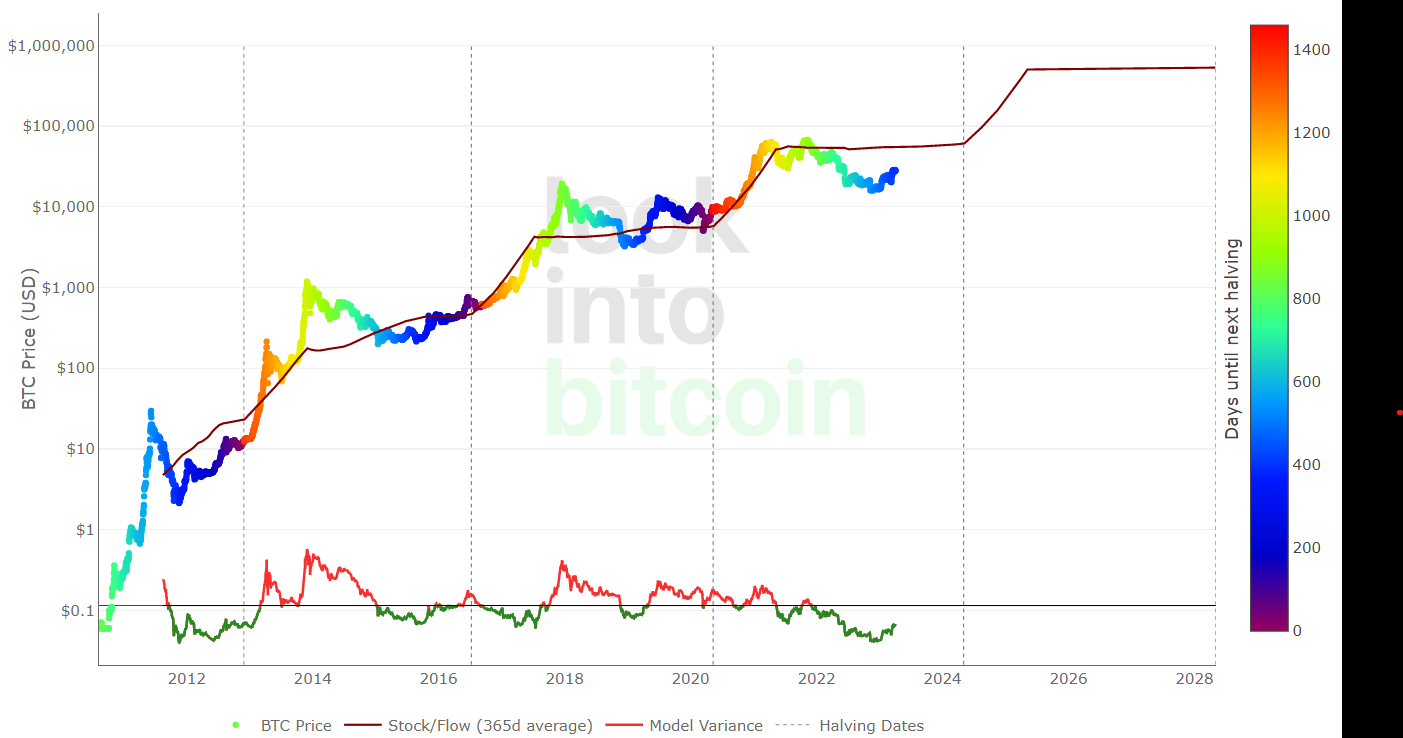
According to the Bitcoin Stock-to-Flow pricing model, the Bitcoin market cycle is roughly four years, which shows an estimated price level based on the number of BTC available in the market relative to the amount being mined each year.
Bitcoin’s fair price right now is around $55K and could rise above $500K in the next post-halving market cycle – that’s around 18x gains from current levels.
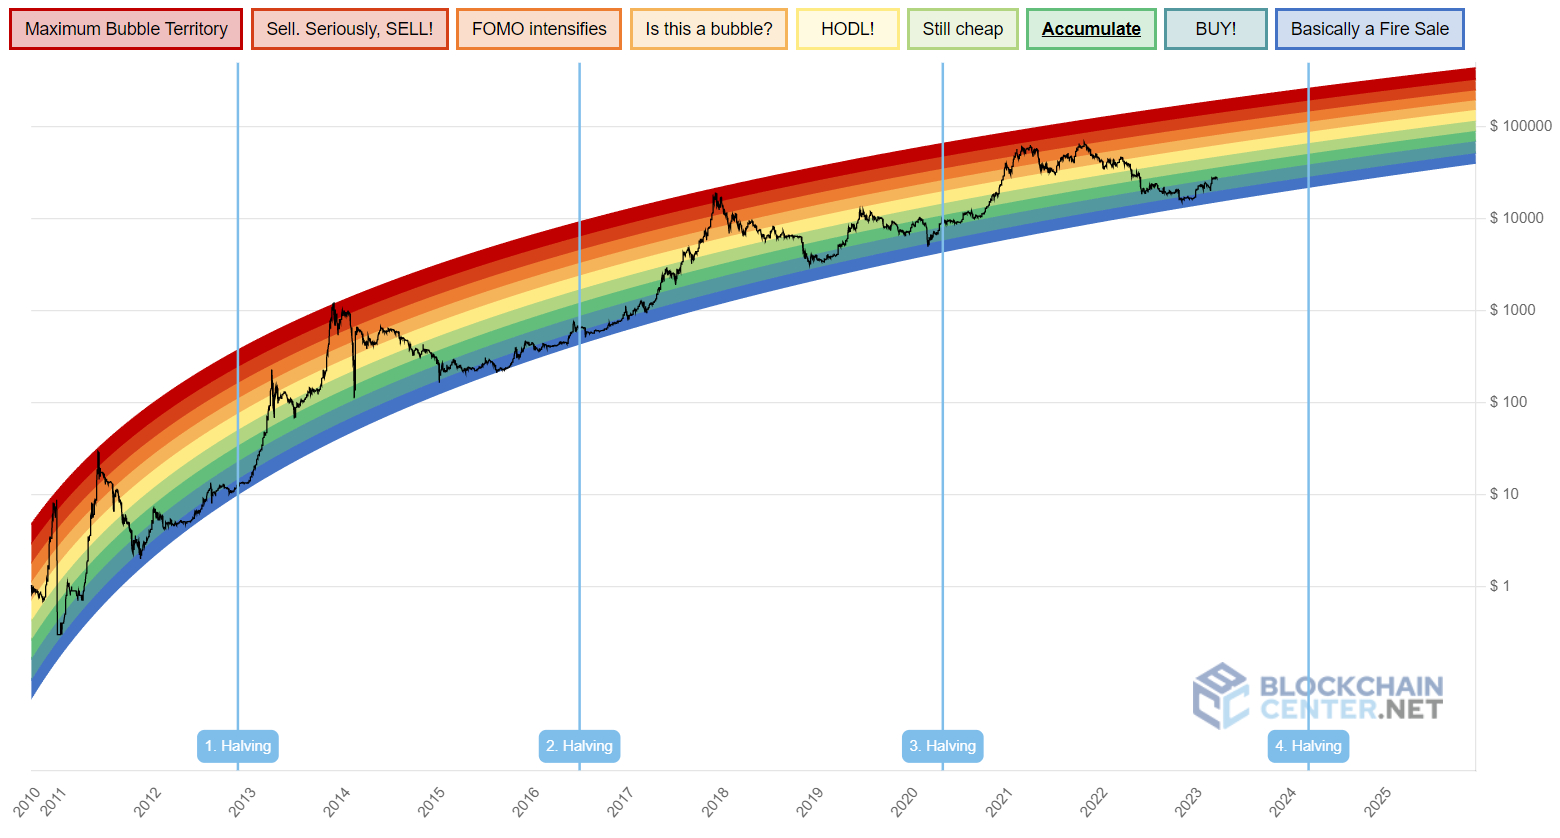
Finally, Blockchaincenter.net’s popular Bitcoin Rainbow Chart shows that, at current levels, Bitcoin is in the “BUY!” zone, having recently recovered from the “Basically a Fire Sale” zone in late 2022. In other words, the model suggests that Bitcoin is gradually recovering from being highly oversold. During its last bull run, Bitcoin was able to reach the “Sell. Seriously, SELL!” zone.
Major cryptocurrency exchanges have been experiencing net negative BTC flows into their Bitcoin wallets over the last few days, according to on-chain data presented by crypto analytics firm Glassnode.

Flows into exchange wallets had been mostly positive since mid-February and the reversal could be a sign that sentiment in the Bitcoin market is improving.
That’s because investors/traders tend to move their Bitcoin to exchange wallets when they want to sell (resulting in net inflows to exchanges), while moving their BTC off of exchanges when they want to HODL.
Net exchange flows have a weak correlation to price performance, but some are nonetheless interpreting the recent shift in flows as another warning sign that the Bitcoin price is on the verge of vaulting above $30,000.
Bitcoin was last changing hands close to $28,000 on major exchanges, up around 70% on the year.
Is Bitcoin About to Vault Above $30,000?
Bitcoin analysts have many other arguments as to why they think the BTC price might soon see its next leg higher to take out $30,000.
Beginning with macro tailwinds, the main driver of the price rise last month – concerns remain about a possible bank crisis in the US (and globally), which continues to underpin Bitcoin demand as a potential safe haven.
Meanwhile, a spate of weaker-than-expected US data releases out so far on the week (the manufacturing and services ISM reports, JOLTs Jobs Data and ADP National Employment figures) have weighed on the US dollar and US yields by pumping bets for a US recession later this year.
This has resulted in markets further pulling back their bets for anything further Fed tightening – according to the CME’s Fed Watch Tool, money markets imply just a 44% chance that the Fed goes ahead with one more hike next month.

Moreover, money markets continue to bet on a rate-cutting cycle to begin in the second half of the year.
A weaker dollar, lower yields and bets on a more dovish Fed have historically boosted crypto prices.
Macro looks set to remain a major Bitcoin tailwind, so long as upcoming US data (like Friday’s jobs report) doesn’t push back against the US recession narrative and the bank situation remains sensitive.
Bitcoin Network Showing Signs of Strength
At the same time as the macro environment turns more favorable for Bitcoin, its underlying network is showing signs of strength.
According to Glassnode, the 7-Day Moving Average Number of Daily Active Addresses recently jumped to its highest level in nearly one year of over 1 million.

The 7-Day Moving Average Number of New Addresses is close to its highest level since May 2021.

Meanwhile, the 7-Day Moving Average Number of Daily Transactions just jumped to its highest level since early 2021 of nearly 350,000.

Strength in Bitcoin network activity suggests more people are using the network, suggesting more demand and a higher value for Bitcoin.
Where Next for the BTC Price?
Bitcoin’s near-term technical picture is looking a little mixed. The cryptocurrency is trading strongly above all of its major moving averages still, with the 21DMA recently offering good support.
Its 14-Day Relative Strength Index is also not in overbought territory, suggesting there is room for upside to occur without an elevated risk of profit-taking getting in the way.
However, things could go either way for BTC, given price action has formed into a pennant structure in recent days that could break out in either direction.
Whilst the above-noted fundamentals and on-chain factors suggest further upside is possible, Bitcoin’s price has been seeing bearish divergence with its RSI, which some take as a bearish sign.

A downside breakout would open the door to the possibility of a swift retest of resistance-turned-support in the $26,500 area and possibly of the key $25,500 support zone below that, which coincides with the 50DMA.
But Expect Dip Buyer Demand to Remain Strong
In the current market environment, however, expect any such dips to attract significant demand.
Bitcoin’s recent strong bounce from its 200DMA (and Realized Price) under $20,000 and the “golden cross” seen in early February are very bullish long-term technical signs for the cryptocurrency.
Meanwhile, various longer-term focused on-chain indicators, such as those grouped in Glassnode’s “Recovering from a Bitcoin Bear” dashboard, are all flashing signals that a new bull market is here.
Analysis of Bitcoin’s longer-term market cycles also suggests a new Bitcoin bull market is here.

According to the Bitcoin Stock-to-Flow pricing model, the Bitcoin market cycle is roughly four years, which shows an estimated price level based on the number of BTC available in the market relative to the amount being mined each year.
Bitcoin’s fair price right now is around $55K and could rise above $500K in the next post-halving market cycle – that’s around 18x gains from current levels.

Finally, Blockchaincenter.net’s popular Bitcoin Rainbow Chart shows that, at current levels, Bitcoin is in the “BUY!” zone, having recently recovered from the “Basically a Fire Sale” zone in late 2022. In other words, the model suggests that Bitcoin is gradually recovering from being highly oversold. During its last bull run, Bitcoin was able to reach the “Sell. Seriously, SELL!” zone.

