At current levels in the mid-$29,000s, the Bitcoin (BTC) price is up over 6.0% in the last 24 hours according to CoinGecko.
Indeed, while still down around 4.5% versus the 10-month highs it hit earlier this month above $31,000, Bitcoin has now rebounded close to 10% since testing its 50-Day Moving Average in the $27,000 area a few days ago.
And with bank crisis concerns back in focus as First Republic comes under scrutiny once again (creating safe-haven demand for Bitcoin) and tech stocks surging (with which Bitcoin is positively correlated), bulls are preparing for a price blowout to the north of the psychologically important $30,000 level.
And macro fundamentals aren’t Bitcoin’s only tailwind right now.
The cryptocurrency continues to benefit from technical buying as a result of 1) the strong rebound from the 50DMA, 2) the strong rebound from the 200DMA and realized price back in March under $20,000 and 3) the “golden cross” in early February.
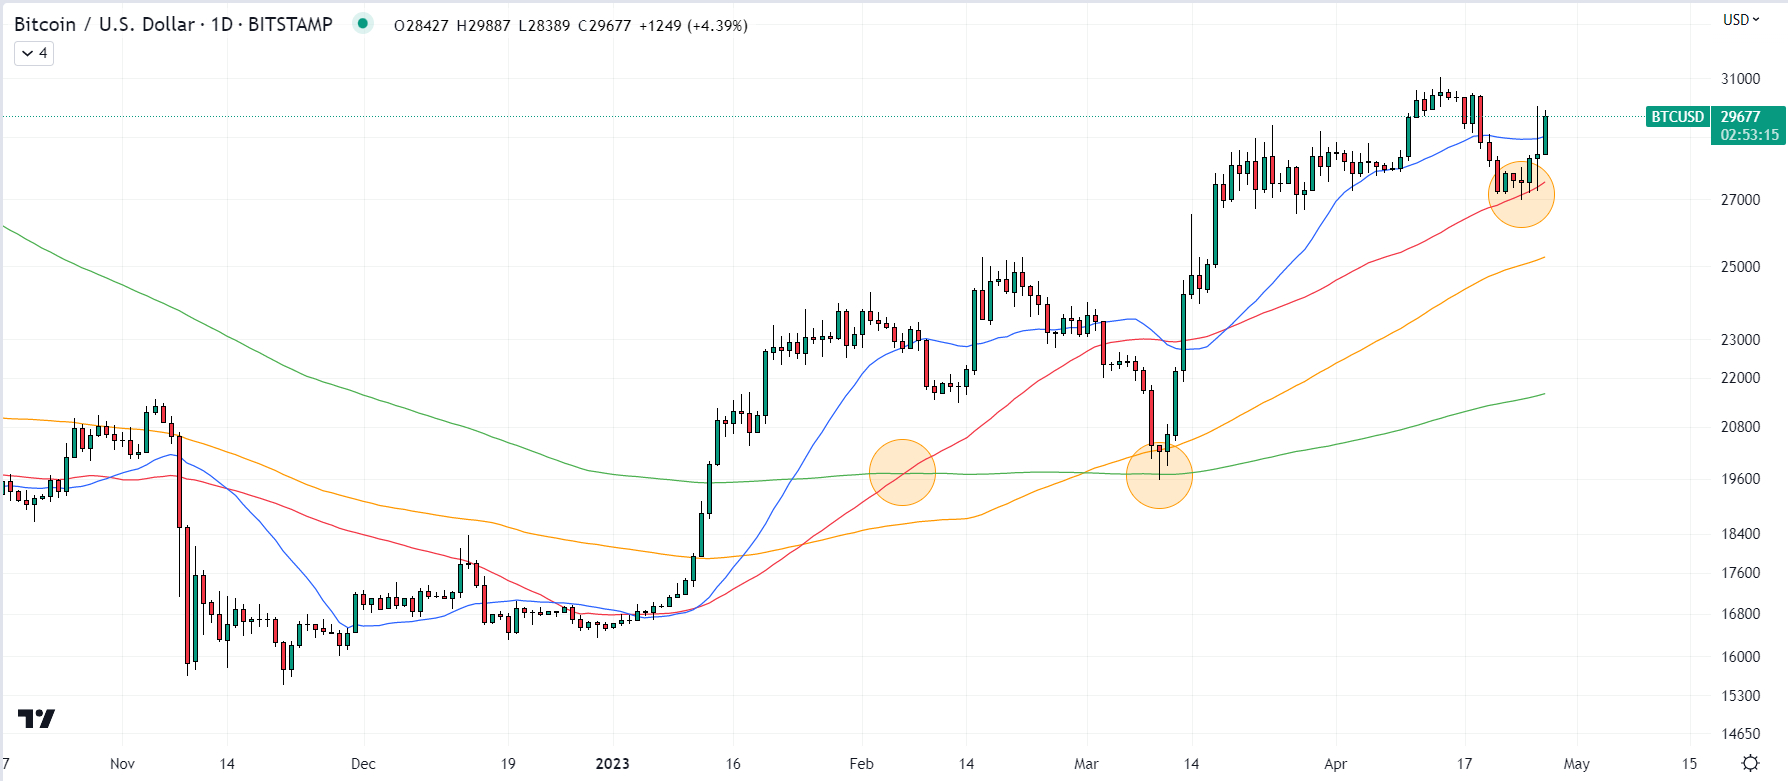
A number of analysts noted on Twitter that Bitcoin appears to be following in the steps of a rally it saw in 2019 where the cryptocurrency posed lows that kept curving higher.
One analyst asked whether we are about to see an “impulsive” rally in Bitcoin towards $50,000.
History Suggests a Bitcoin’s Uptrend Should Continue
Analysis of Bitcoin’s longer-term market cycle suggests that it would be historically normal for the cryptocurrency to remain in a strong uptrend for the foreseeable future, adding to the reasons why bulls should expect a near-term push to the north of $30,000.
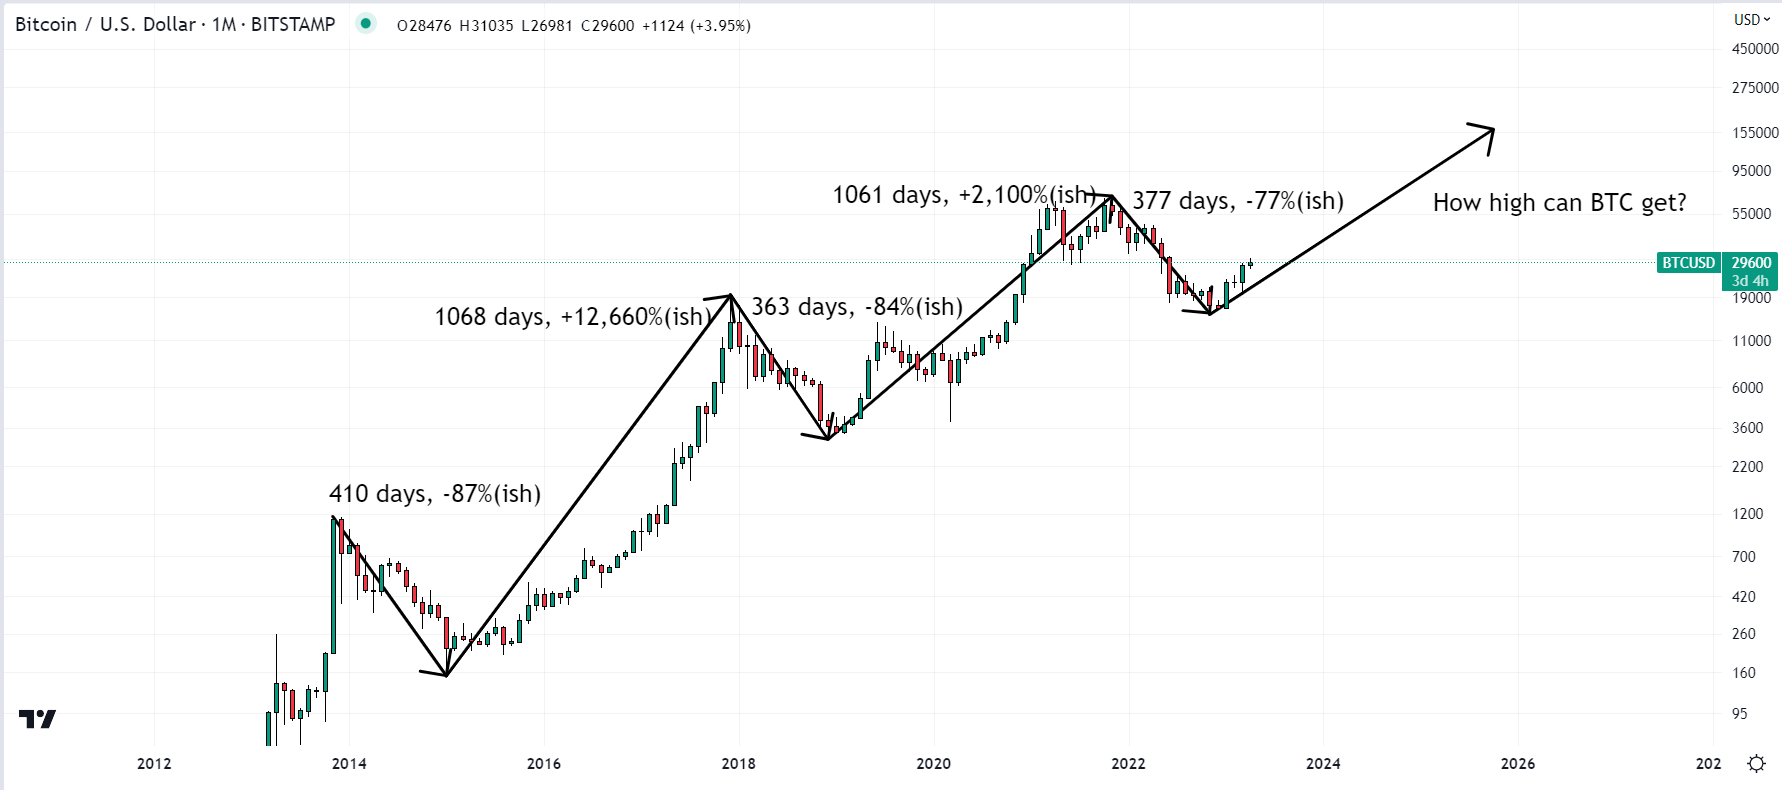
From the bottom of the 2015 bear market to the top of the 2017 bull market, Bitcoin gained a staggering more than 12,500%.
From the bottom of its 2018 bear market to the top of its 2021 bull market, Bitcoin gained a still impressive 2,100%.
Assuming diminishing returns from each bear market comeback continue, could Bitcoin perhaps be looking at a 1,000% (11x) bounce from its 2022 lows?
That would imply Bitcoin reaching the $165,000 area sometime in the next few years.
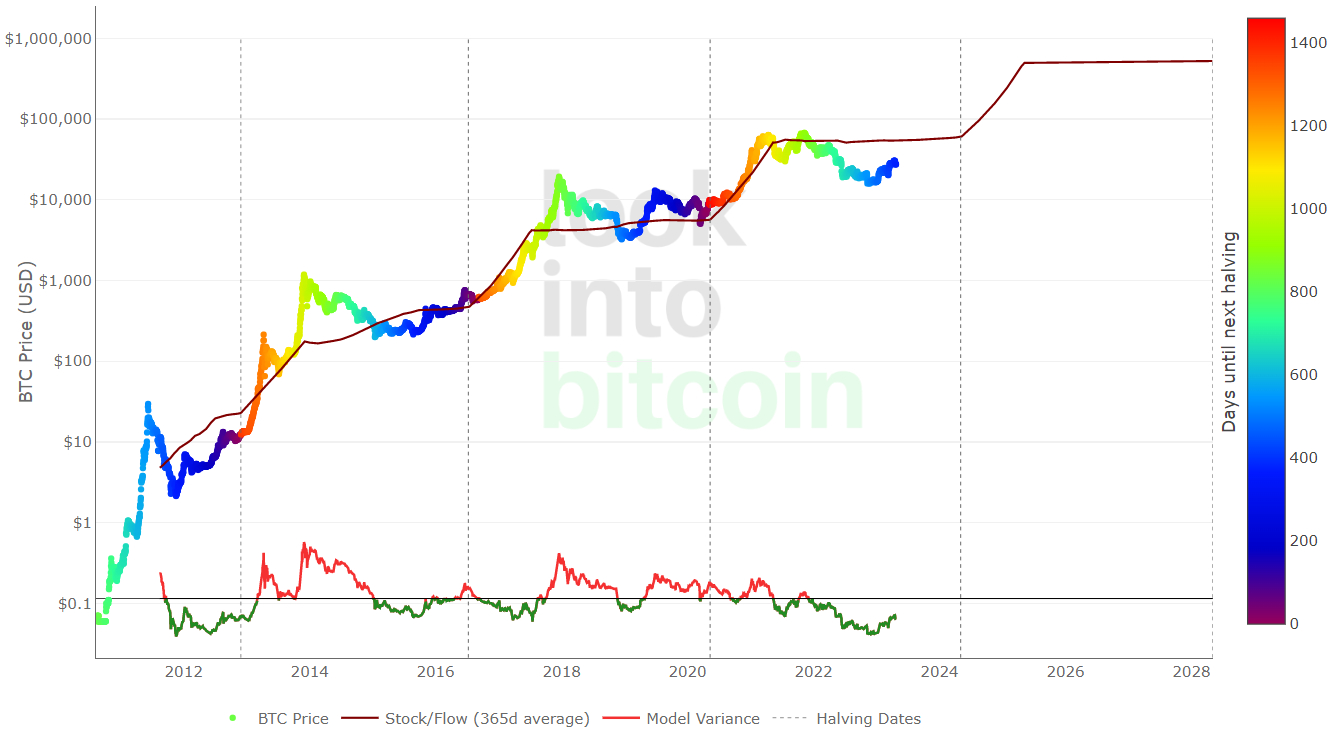
Elsewhere, according to the Bitcoin Stock-to-Flow pricing model, the Bitcoin market cycle is roughly four years, which shows an estimated price level based on the number of BTC available in the market relative to the amount being mined each year.
Bitcoin’s fair price right now is around $55K and could rise above $500K in the next post-halving market cycle – that’s around 20x gains from current levels.
Meanwhile, Blockchaincenter.net’s popular Bitcoin Rainbow Chart shows that, at current levels, Bitcoin is in the “Accumulate” zone, having recently recovered from the “Basically a Fire Sale” zone in late 2022. In other words, the model suggests that Bitcoin is gradually recovering from being highly oversold. During its last bull run, Bitcoin was able to reach the “Sell. Seriously, SELL!” zone.
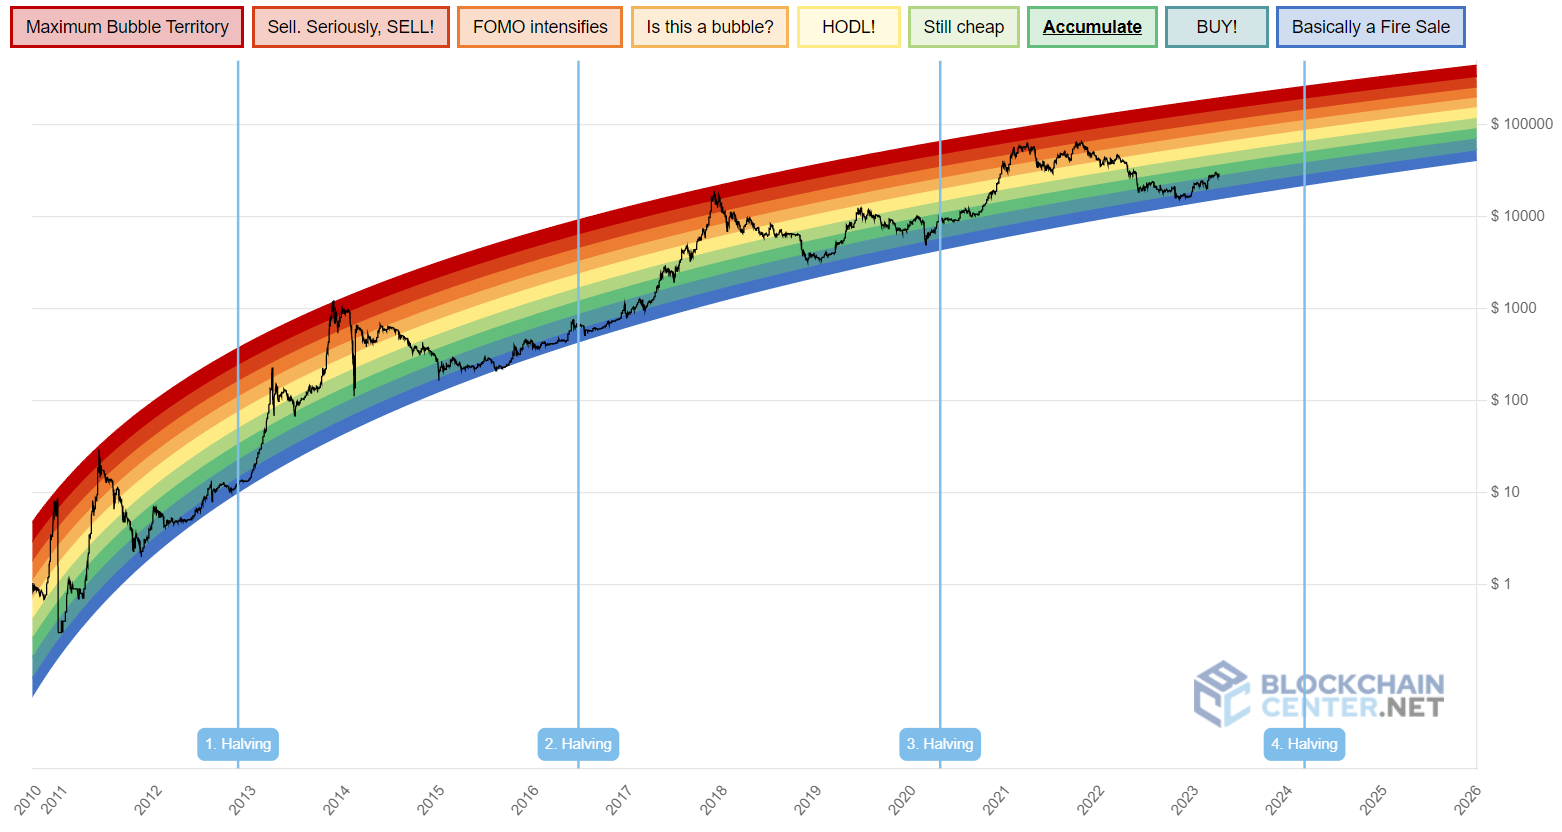
If it can repeat this feat in the next post-halving market cycle within one to one and a half years after the next halving, the model suggests a possible Bitcoin price in the $200-$300K region. That’s around 7-10x gains from current levels.
Bitcoin Bulls Need to Watch These Resistance Levels
Assuming the BTC price does swiftly pop back to the north of the $30,000, as a trading signal tracked by Bloomberg suggested is historically likely last week, the first major resistance area for traders to watch is going to be in the $32,500-$33,000 region in the form of the late-May 2022 high and January 2022 low.
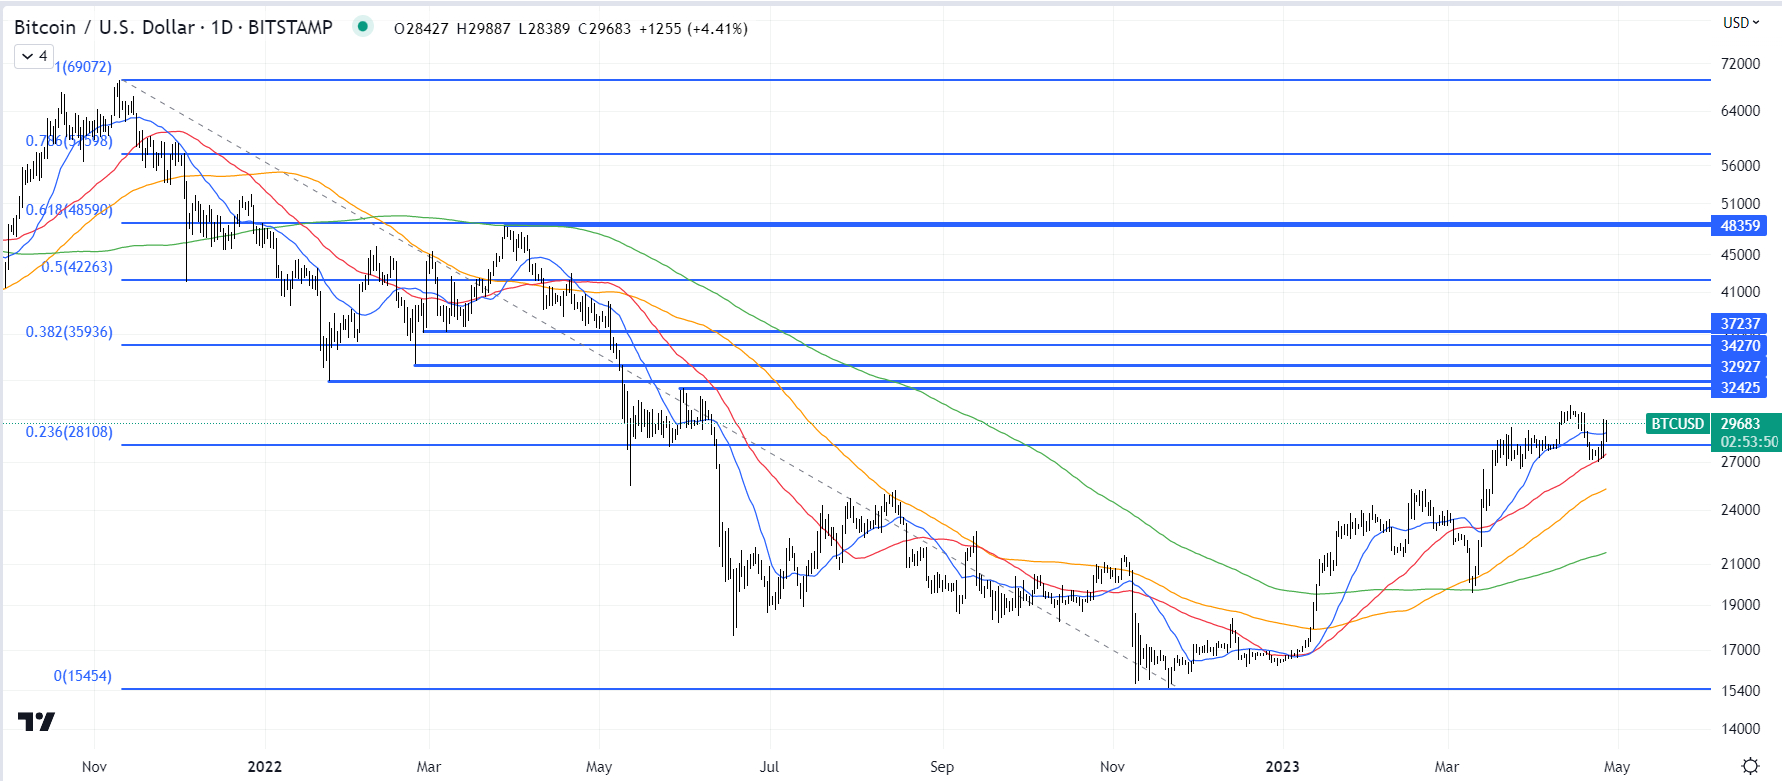
The next key level above that is the February 2022 low around $34,000, then the 38.2% Fibonacci retracement level from the 2022 lows to the 2021 record highs just under $36,000, then an old support zone in the mid-$37,000s.
If Bitcoin can hurdle all of these levels, it is likely in for a swift rally above $40,000 and a test of the 50% Fibonacci retracement level from the 2022 lows back to the 2021 highs in the low $42,000s.
At current levels in the mid-$29,000s, the Bitcoin (BTC) price is up over 6.0% in the last 24 hours according to CoinGecko.
Indeed, while still down around 4.5% versus the 10-month highs it hit earlier this month above $31,000, Bitcoin has now rebounded close to 10% since testing its 50-Day Moving Average in the $27,000 area a few days ago.
And with bank crisis concerns back in focus as First Republic comes under scrutiny once again (creating safe-haven demand for Bitcoin) and tech stocks surging (with which Bitcoin is positively correlated), bulls are preparing for a price blowout to the north of the psychologically important $30,000 level.
And macro fundamentals aren’t Bitcoin’s only tailwind right now.
The cryptocurrency continues to benefit from technical buying as a result of 1) the strong rebound from the 50DMA, 2) the strong rebound from the 200DMA and realized price back in March under $20,000 and 3) the “golden cross” in early February.

A number of analysts noted on Twitter that Bitcoin appears to be following in the steps of a rally it saw in 2019 where the cryptocurrency posed lows that kept curving higher.
One analyst asked whether we are about to see an “impulsive” rally in Bitcoin towards $50,000.
History Suggests a Bitcoin’s Uptrend Should Continue
Analysis of Bitcoin’s longer-term market cycle suggests that it would be historically normal for the cryptocurrency to remain in a strong uptrend for the foreseeable future, adding to the reasons why bulls should expect a near-term push to the north of $30,000.
From the bottom of the 2015 bear market to the top of the 2017 bull market, Bitcoin gained a staggering more than 12,500%.
From the bottom of its 2018 bear market to the top of its 2021 bull market, Bitcoin gained a still impressive 2,100%.
Assuming diminishing returns from each bear market comeback continue, could Bitcoin perhaps be looking at a 1,000% (11x) bounce from its 2022 lows?
That would imply Bitcoin reaching the $165,000 area sometime in the next few years.

Elsewhere, according to the Bitcoin Stock-to-Flow pricing model, the Bitcoin market cycle is roughly four years, which shows an estimated price level based on the number of BTC available in the market relative to the amount being mined each year.
Bitcoin’s fair price right now is around $55K and could rise above $500K in the next post-halving market cycle – that’s around 20x gains from current levels.

Meanwhile, Blockchaincenter.net’s popular Bitcoin Rainbow Chart shows that, at current levels, Bitcoin is in the “Accumulate” zone, having recently recovered from the “Basically a Fire Sale” zone in late 2022. In other words, the model suggests that Bitcoin is gradually recovering from being highly oversold. During its last bull run, Bitcoin was able to reach the “Sell. Seriously, SELL!” zone.

If it can repeat this feat in the next post-halving market cycle within one to one and a half years after the next halving, the model suggests a possible Bitcoin price in the $200-$300K region. That’s around 7-10x gains from current levels.
Bitcoin Bulls Need to Watch These Resistance Levels
Assuming the BTC price does swiftly pop back to the north of the $30,000, as a trading signal tracked by Bloomberg suggested is historically likely last week, the first major resistance area for traders to watch is going to be in the $32,500-$33,000 region in the form of the late-May 2022 high and January 2022 low.

The next key level above that is the February 2022 low around $34,000, then the 38.2% Fibonacci retracement level from the 2022 lows to the 2021 record highs just under $36,000, then an old support zone in the mid-$37,000s.
If Bitcoin can hurdle all of these levels, it is likely in for a swift rally above $40,000 and a test of the 50% Fibonacci retracement level from the 2022 lows back to the 2021 highs in the low $42,000s.
