A widely followed suite of on-chain and technical metrics are sending bullish signs for the Bitcoin price, with BTC/USD holding close to nine-month highs just above $28,000 as markets digest Wednesday’s US Federal Reserve policy meeting.
Bitcoin initially sold off on Wednesday in a “sell the fact” reaction to the US central bank lifting interest rates by 25 bps as expected, and softening its tone on the outlook for further rate hikes amid troubles in the banking sector.
But the world’s largest cryptocurrency was able to regain its poise and recover back above $28,000 on Thursday as narratives around Bitcoin being a safe haven against fragility in the US (and global) banking system and around the Fed’s dovish pivot enticed bulls to buy the dip.
All the while, a suite of on-chain and technical indicators that collectively have a strong track record of predicting when Bitcoin is transitioning back into a bull market from a period of bearishness continues to flash long-term bullish signals.
Indeed, seven out of eight of the metrics tracked in crypto data analytics firm Glassnode’s “Recovering from a Bitcoin Bear” dashboard currently fulfill the condition for Bitcoin being in the early stages of a new bull market.
The dashboard tracks eight indicators to ascertain whether Bitcoin is trading above key pricing models, whether or not network utilization momentum is increasing, whether market profitability is returning and whether the balance of USD-denominated Bitcoin wealth favors the long-term HODLers.
When all eight are flashing green, this has historically been a strong bullish sign for the Bitcoin market.
Signals 1 and 2: Bitcoin is Above its 200DMA and Realized Price
Bitcoin is trading comfortably above its 200DMA and Realized Price, the first two of the eight signals tracked by Glassnode. A break above these key levels is viewed by many as an indicator that near-term price momentum is shifting in a positive direction.
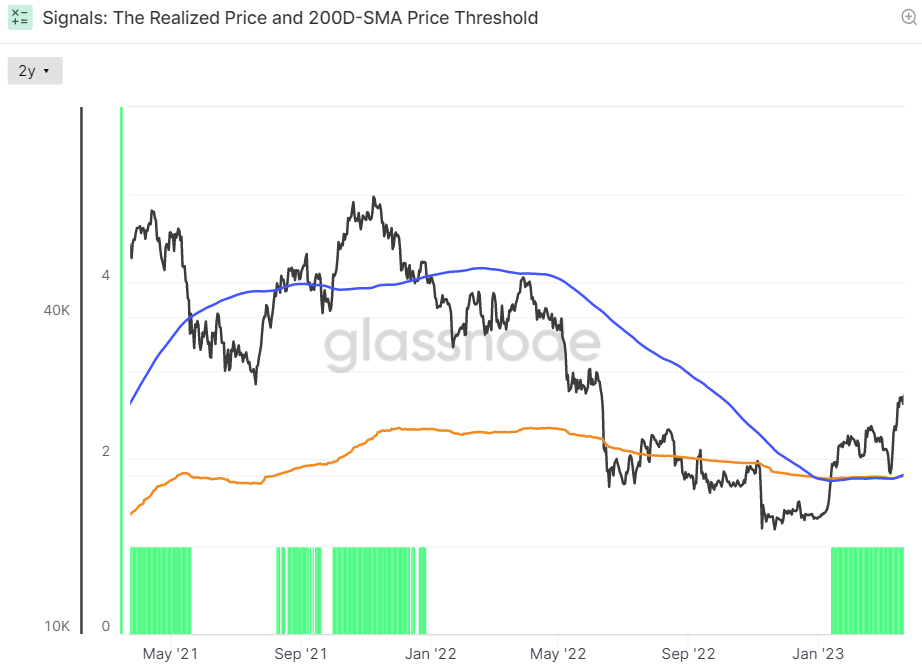
Equally, when the Bitcoin price mounts a powerful defense of these levels, as it did when it retested them earlier this month, that is also seen as a key technical validation that the bull market remains in play.
Signal 3: New Address Momentum
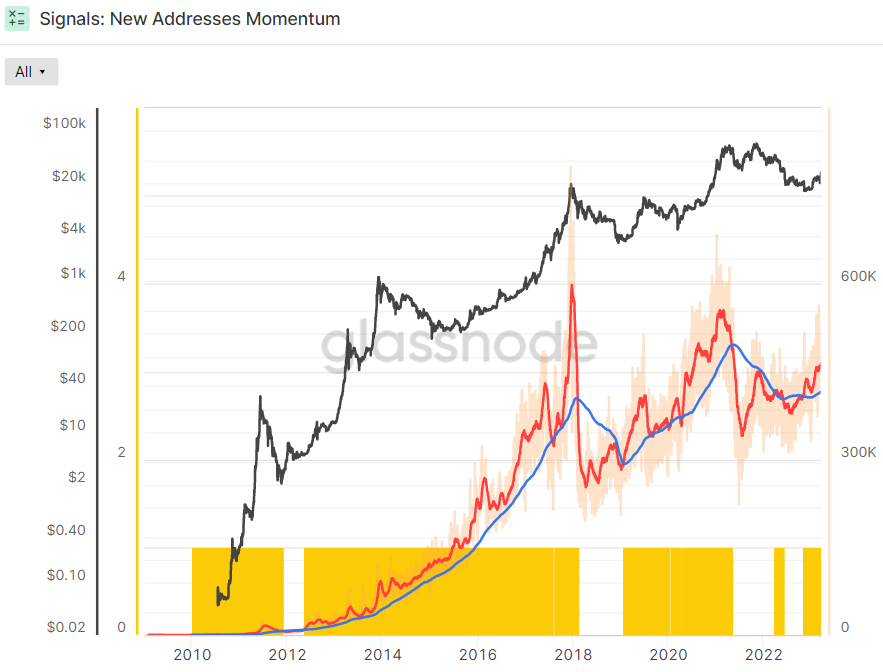
The 30-Day SMA of new Bitcoin address creation moved above its 365-Day SMA a few months ago, a sign that the rate at which new Bitcoin wallets are being created is accelerating. This has historically occurred at the start of bull markets.
Signal 4: Revenue from Fees Multiple
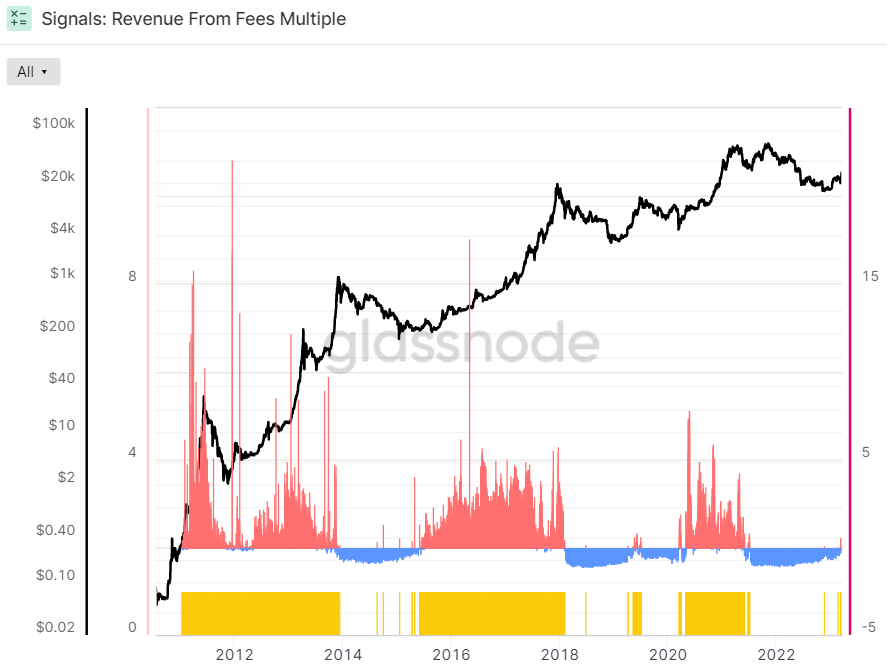
Meanwhile, the two-year Z-score of the Revenue From Fees Multiple turned decisively positive a few days ago. The Z-score is the number of standard deviations above or below the mean of a data sample. In this instance, Glassnode’s Z-score is the number of standard deviations above or below the mean Bitcoin Fee Revenue of the last 2-years.
Signal 5 and 6: Realized P/L Ratio and aSOPR in Profit
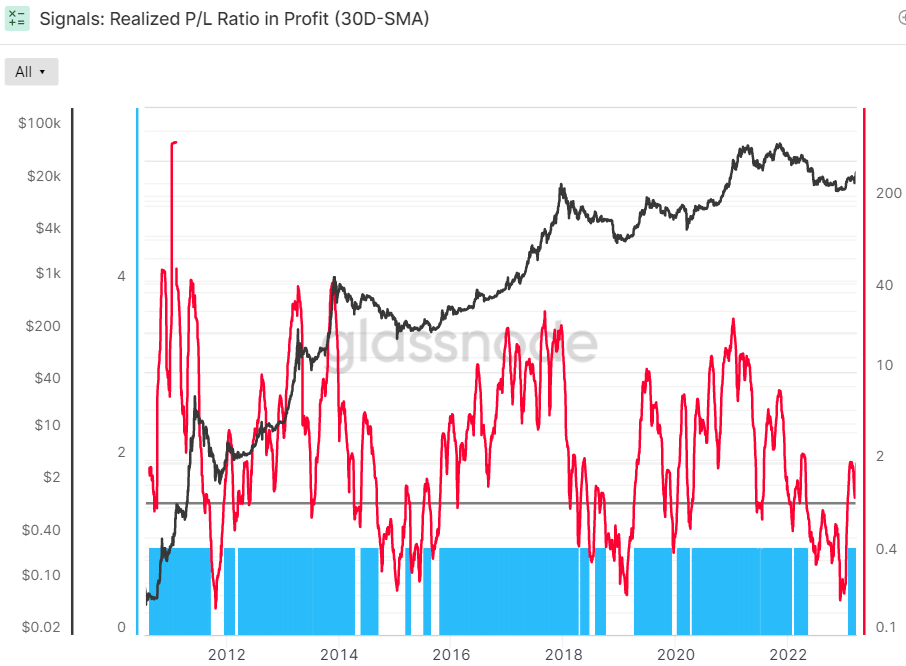
Moving on to the fifth and sixth indicators relating to market profitability; the market’s recovery from earlier monthly lows helped keep the 30-Day Simple Moving Average (SMA) of the Bitcoin Realized Profit-Loss Ratio (RPLR) indicator above one.
When the RPLR is above one, this means that Bitcoin market is realizing a greater proportion of profits (denominated in USD) than losses. According to Glassnode, “this generally signifies that sellers with unrealized losses have been exhausted, and a healthier inflow of demand exists to absorb profit taking”. Hence, this indicator continues to send a bullish signal.
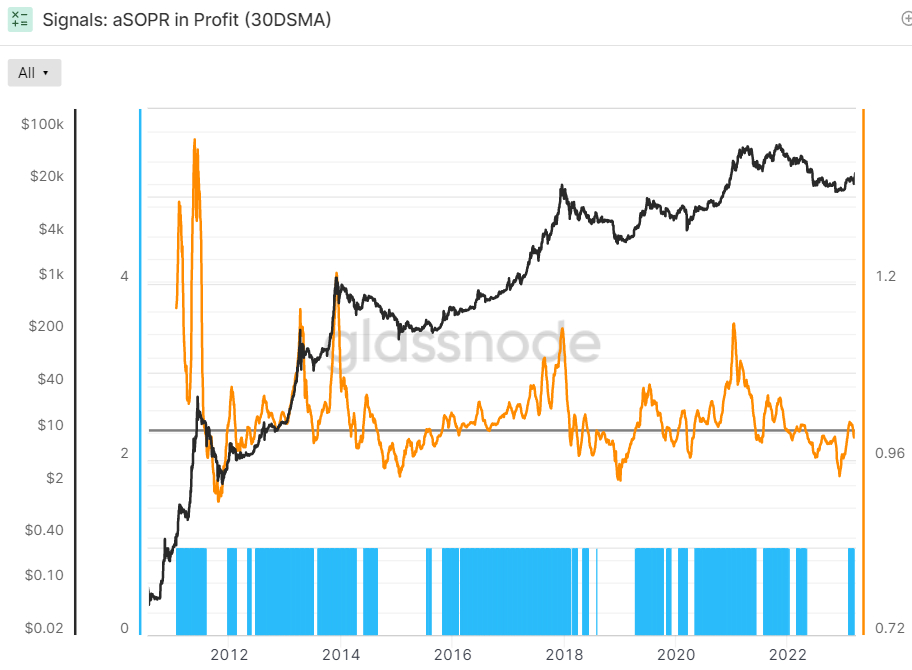
The 30-day SMA of Bitcoin’s Adjusted Spent Output Profit Ration (aSOPR) indicator, an indicator that reflects the degree of realized profit and loss for all coins moved on-chain, recently dipped below one (meaning it is no longer sending a bull signal). That essentially means that on average over the past 30 days, the market is no longer in profit.
However, amid the recovery in the Bitcoin price from earlier monthly lows to new nine-month highs above $28,000, this indicator should soon recover back above one. That would mean all eight of Glassnode’s indicators are flashing green. Looking back over the last eight years of Bitcoin history, the aSOPR rising above 1 after a prolonged spell below it has been a fantastic buy signal.
Signal 7 and 8: RHODL Multiple and Supply in Profit
Finally, there are the final two indicators that relate to whether the balance of USD wealth had sufficiently swung back in favor of the HODLers to signal weak-hand seller exhaustion.
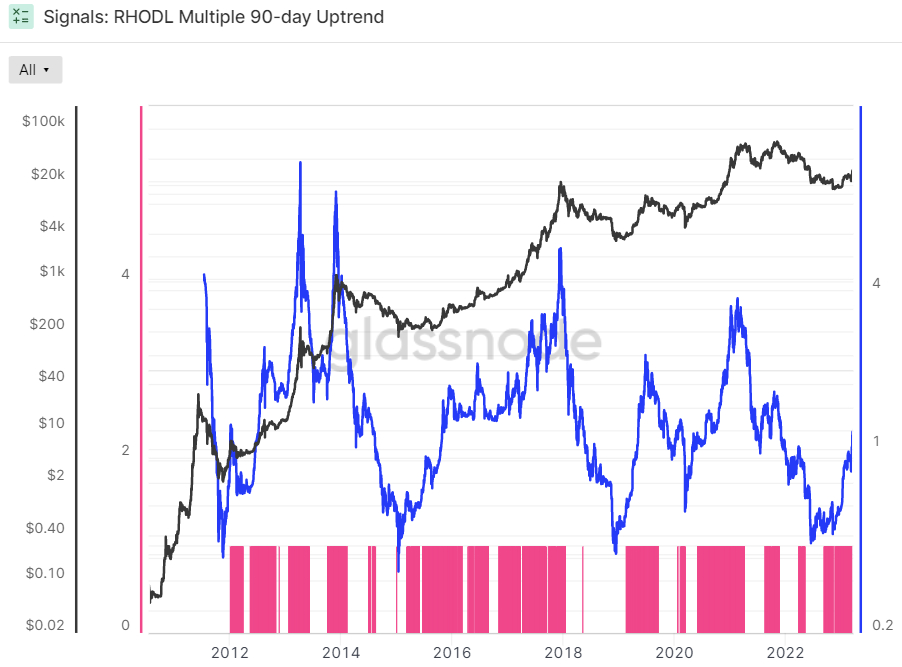
The Bitcoin Realized HODL Multiple has been in an uptrend over the last 90 days, a bullish sign according to Glassnode. The crypto analytics firm states that “when the RHODL Multiple transitions into an uptrend over a 90-day window, it indicates that USD-denominated wealth is starting to shift back towards new demand inflows”.
It “indicates profits are being taken, the market is capable of absorbing them… (and) that longer-term holders are starting to spend coins” Glassnode states.
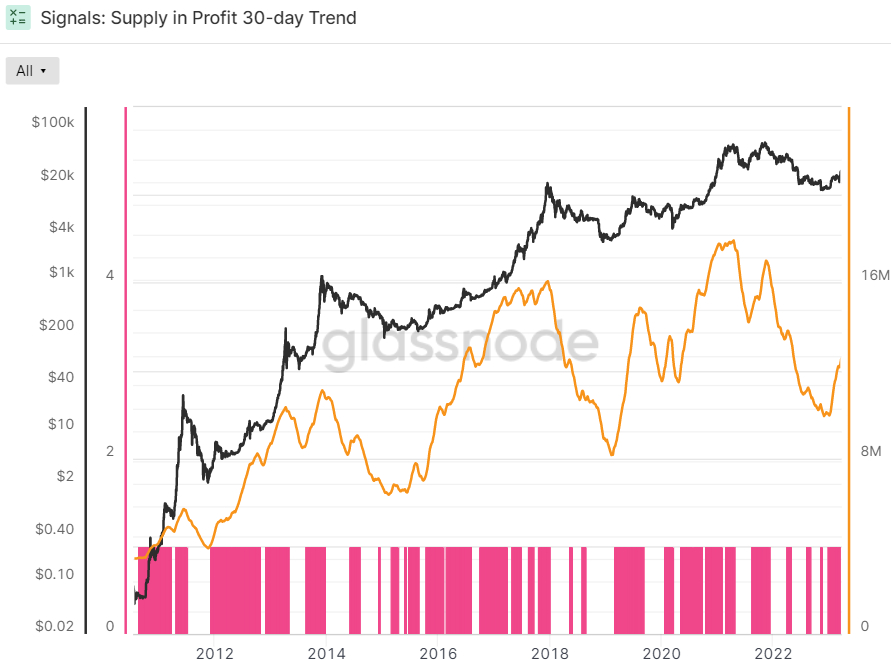
Glassnode’s final indicator in its Recovering from a Bitcoin Bear dashboard is whether or not the 90-day Exponential Moving Average (EMA) of Bitcoin Supply in Profit has been in an uptrend over the last 30 days or not. Supply in Profit is the number of Bitcoins that last moved when USD-denominated prices were lower than they are right now, implying they were bought for a lower price and the wallet is holding onto a paper profit. This indicator is also flashing green.
Where Next for BTC?
Many analysts think that Bitcoin’s next stop will be a test of the $30,000 level, but some have expressed doubts about BTC’s ability to muster a sustained break above this level in the absence of new bullish catalysts.
These catalysts could be further contagion and crisis concerns in the US banking sector, which could spur fresh safe-haven demand for Bitcoin. Alternatively, if Fed communications give markets reason to extend their interest rate cut bets for the year ahead, that could boost Bitcoin amid easing financial conditions.
But even in the absence of these catalysts, continued positive trends in Bitcoin market fundamentals amid growing adoption and a growing narrative that 2022’s bear market is long in the past mean that Bitcoin’s outlook for the remainder of the year still looks very good.
A widely followed suite of on-chain and technical metrics are sending bullish signs for the Bitcoin price, with BTC/USD holding close to nine-month highs just above $28,000 as markets digest Wednesday’s US Federal Reserve policy meeting.
Bitcoin initially sold off on Wednesday in a “sell the fact” reaction to the US central bank lifting interest rates by 25 bps as expected, and softening its tone on the outlook for further rate hikes amid troubles in the banking sector.
But the world’s largest cryptocurrency was able to regain its poise and recover back above $28,000 on Thursday as narratives around Bitcoin being a safe haven against fragility in the US (and global) banking system and around the Fed’s dovish pivot enticed bulls to buy the dip.
All the while, a suite of on-chain and technical indicators that collectively have a strong track record of predicting when Bitcoin is transitioning back into a bull market from a period of bearishness continues to flash long-term bullish signals.
Indeed, seven out of eight of the metrics tracked in crypto data analytics firm Glassnode’s “Recovering from a Bitcoin Bear” dashboard currently fulfill the condition for Bitcoin being in the early stages of a new bull market.
The dashboard tracks eight indicators to ascertain whether Bitcoin is trading above key pricing models, whether or not network utilization momentum is increasing, whether market profitability is returning and whether the balance of USD-denominated Bitcoin wealth favors the long-term HODLers.
When all eight are flashing green, this has historically been a strong bullish sign for the Bitcoin market.
Signals 1 and 2: Bitcoin is Above its 200DMA and Realized Price
Bitcoin is trading comfortably above its 200DMA and Realized Price, the first two of the eight signals tracked by Glassnode. A break above these key levels is viewed by many as an indicator that near-term price momentum is shifting in a positive direction.

Equally, when the Bitcoin price mounts a powerful defense of these levels, as it did when it retested them earlier this month, that is also seen as a key technical validation that the bull market remains in play.
Signal 3: New Address Momentum
The 30-Day SMA of new Bitcoin address creation moved above its 365-Day SMA a few months ago, a sign that the rate at which new Bitcoin wallets are being created is accelerating. This has historically occurred at the start of bull markets.

Signal 4: Revenue from Fees Multiple
Meanwhile, the two-year Z-score of the Revenue From Fees Multiple turned decisively positive a few days ago. The Z-score is the number of standard deviations above or below the mean of a data sample. In this instance, Glassnode’s Z-score is the number of standard deviations above or below the mean Bitcoin Fee Revenue of the last 2-years.

Signal 5 and 6: Realized P/L Ratio and aSOPR in Profit
Moving on to the fifth and sixth indicators relating to market profitability; the market’s recovery from earlier monthly lows helped keep the 30-Day Simple Moving Average (SMA) of the Bitcoin Realized Profit-Loss Ratio (RPLR) indicator above one.
When the RPLR is above one, this means that Bitcoin market is realizing a greater proportion of profits (denominated in USD) than losses. According to Glassnode, “this generally signifies that sellers with unrealized losses have been exhausted, and a healthier inflow of demand exists to absorb profit taking”. Hence, this indicator continues to send a bullish signal.

The 30-day SMA of Bitcoin’s Adjusted Spent Output Profit Ration (aSOPR) indicator, an indicator that reflects the degree of realized profit and loss for all coins moved on-chain, recently dipped below one (meaning it is no longer sending a bull signal). That essentially means that on average over the past 30 days, the market is no longer in profit.
However, amid the recovery in the Bitcoin price from earlier monthly lows to new nine-month highs above $28,000, this indicator should soon recover back above one. That would mean all eight of Glassnode’s indicators are flashing green. Looking back over the last eight years of Bitcoin history, the aSOPR rising above 1 after a prolonged spell below it has been a fantastic buy signal.

Signal 7 and 8: RHODL Multiple and Supply in Profit
Finally, there are the final two indicators that relate to whether the balance of USD wealth had sufficiently swung back in favor of the HODLers to signal weak-hand seller exhaustion.
The Bitcoin Realized HODL Multiple has been in an uptrend over the last 90 days, a bullish sign according to Glassnode. The crypto analytics firm states that “when the RHODL Multiple transitions into an uptrend over a 90-day window, it indicates that USD-denominated wealth is starting to shift back towards new demand inflows”.
It “indicates profits are being taken, the market is capable of absorbing them… (and) that longer-term holders are starting to spend coins” Glassnode states.

Glassnode’s final indicator in its Recovering from a Bitcoin Bear dashboard is whether or not the 90-day Exponential Moving Average (EMA) of Bitcoin Supply in Profit has been in an uptrend over the last 30 days or not. Supply in Profit is the number of Bitcoins that last moved when USD-denominated prices were lower than they are right now, implying they were bought for a lower price and the wallet is holding onto a paper profit. This indicator is also flashing green.

Where Next for BTC?
Many analysts think that Bitcoin’s next stop will be a test of the $30,000 level, but some have expressed doubts about BTC’s ability to muster a sustained break above this level in the absence of new bullish catalysts.
These catalysts could be further contagion and crisis concerns in the US banking sector, which could spur fresh safe-haven demand for Bitcoin. Alternatively, if Fed communications give markets reason to extend their interest rate cut bets for the year ahead, that could boost Bitcoin amid easing financial conditions.
But even in the absence of these catalysts, continued positive trends in Bitcoin market fundamentals amid growing adoption and a growing narrative that 2022’s bear market is long in the past mean that Bitcoin’s outlook for the remainder of the year still looks very good.
