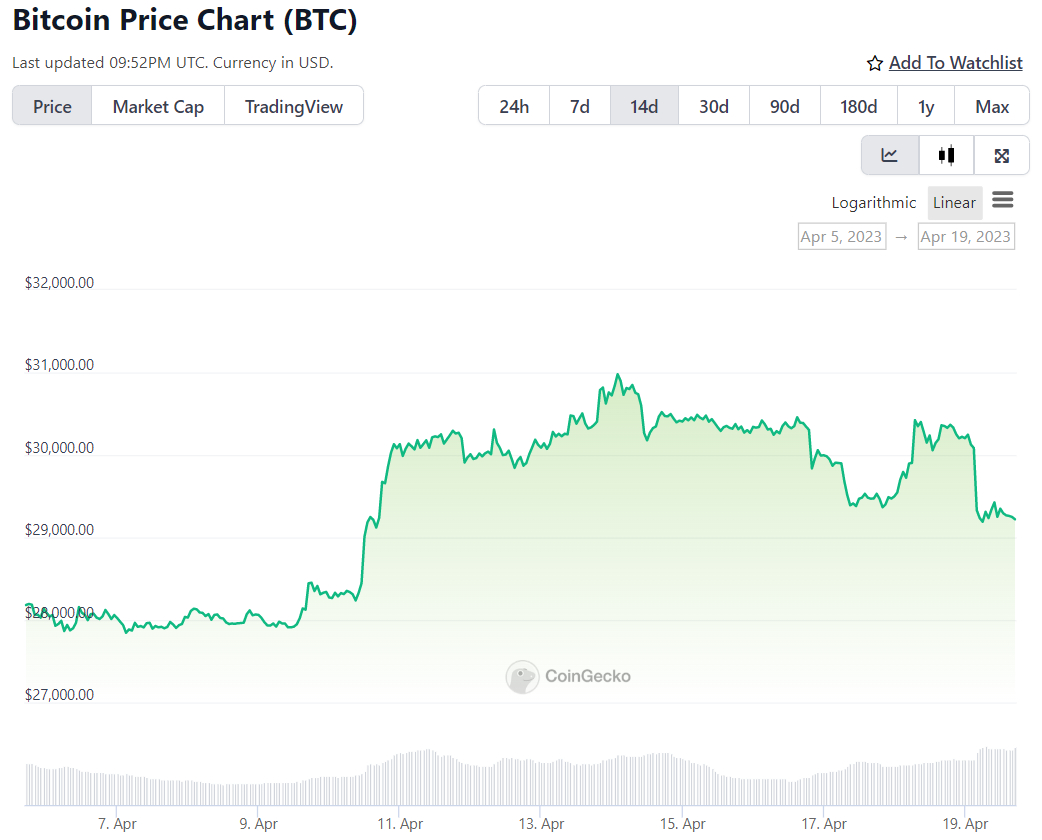
Bitcoin (BTC) is down sharply on Wednesday, with analysts citing a massive sell order on the world’s largest crypto exchange Binance and hotter-than-expected UK inflation data as weighing on the price action.
BTC/USD was last changing hands almost bang on the $29,000 level, nursing losses of around 4.5% on the day, putting the cryptocurrency on course for its worst one-day performance since the 9th of March.
Despite this, liquidations of leveraged long positions in Bitcoin futures remain relatively contained at just over $40 million, as per coinglass.
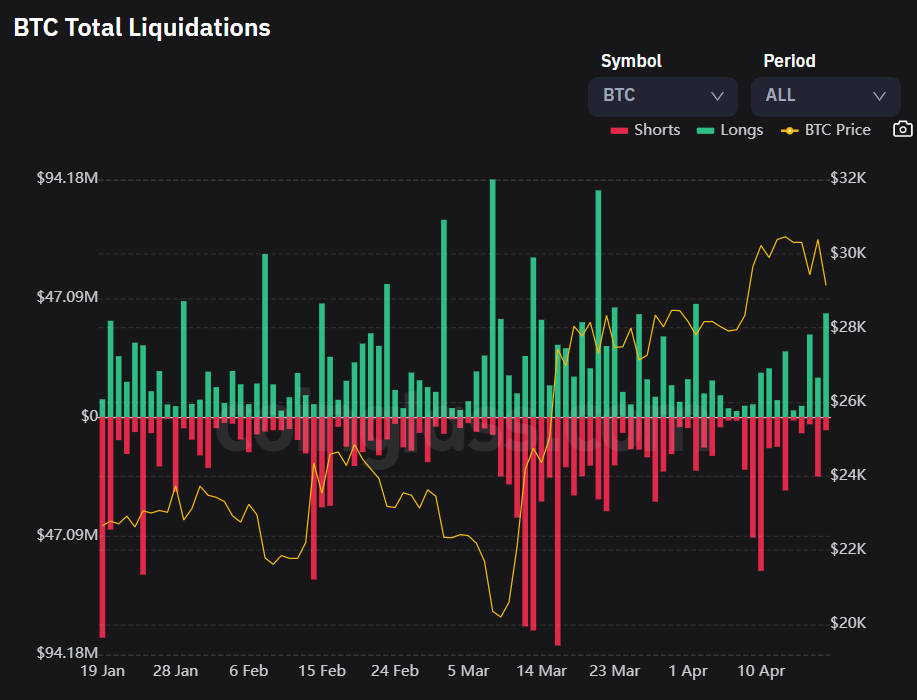
That’s not even the highest this month, suggesting the latest move lower hasn’t triggered much of a long squeeze.
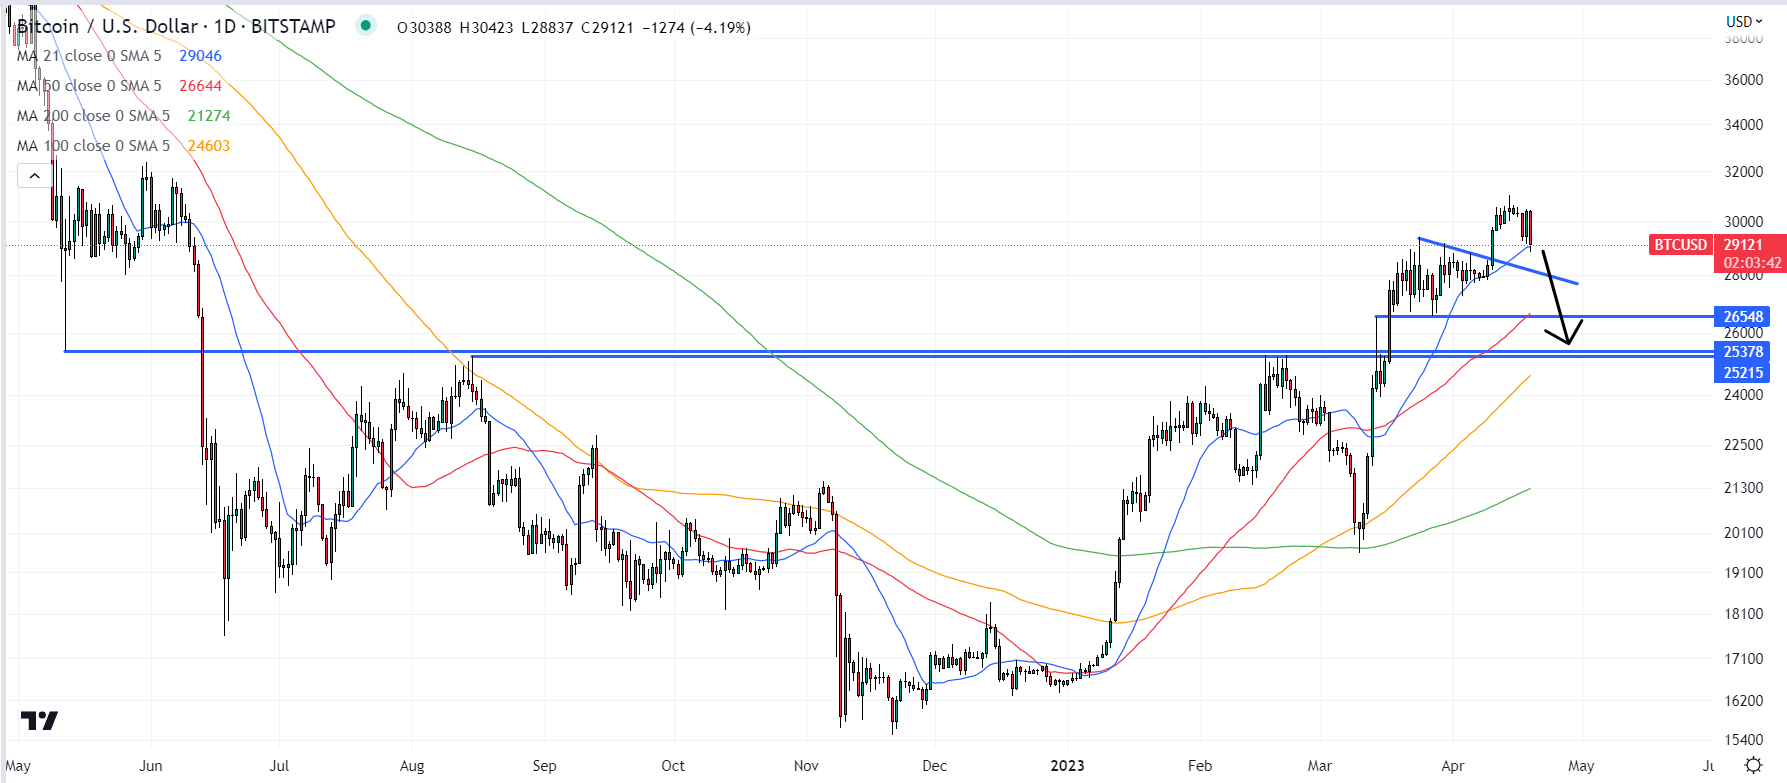
For now, Bitcoin is managing to hold up above the key psychological level, as well as its 21-Day Moving Average just above it at $29,043.
Support in the form of the late March/early April highs in the $28,780-$29,380 area also seems to be keeping a floor under the price for now.
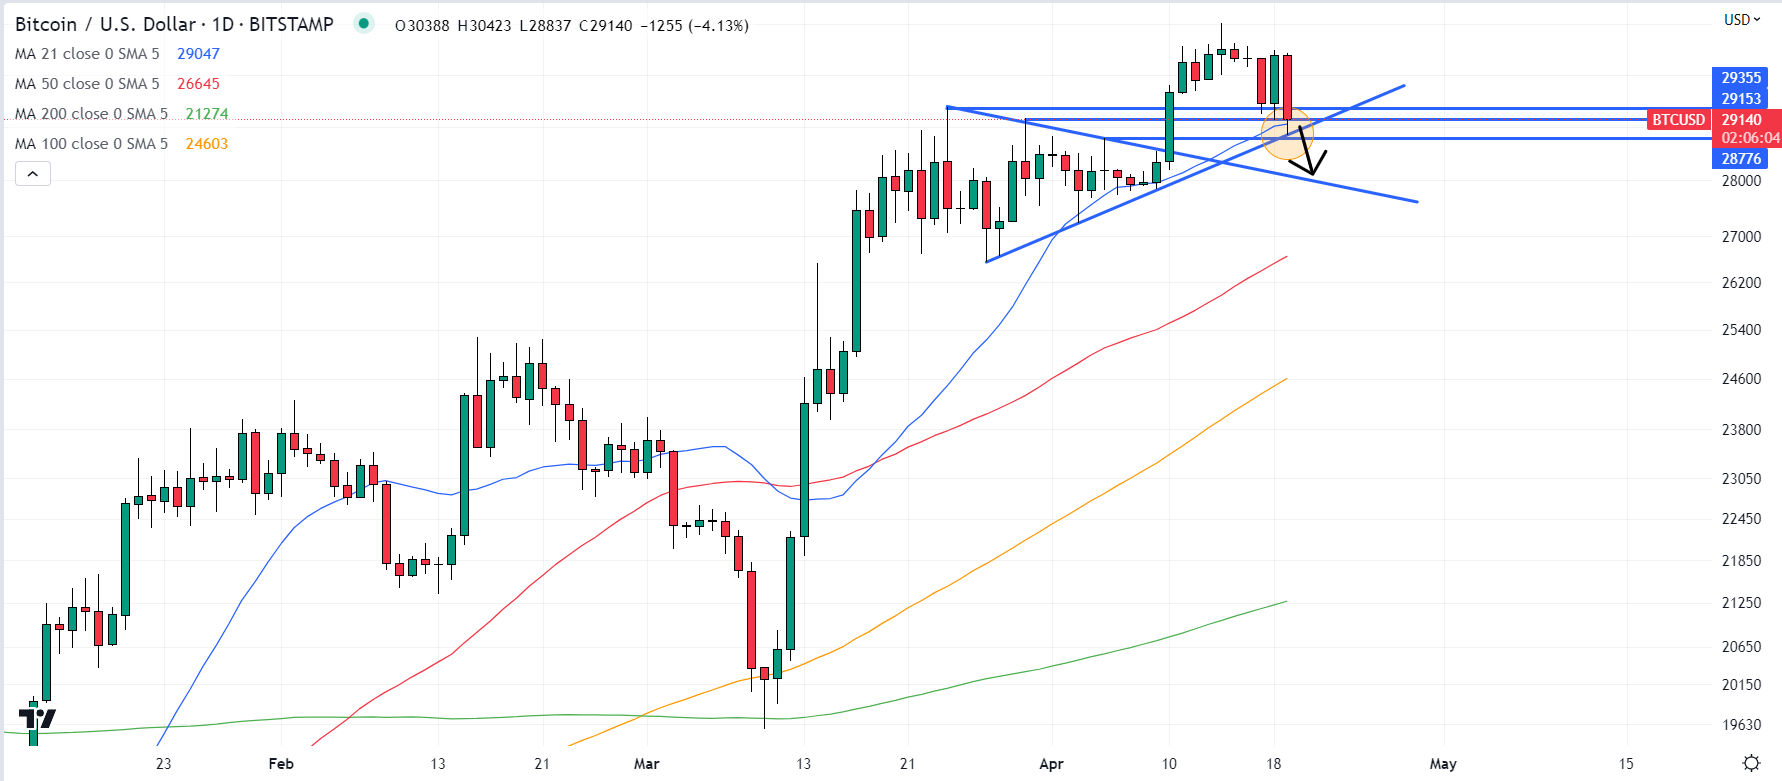
But a break below this key cloud of support could open the door to a quick drop to the $28,000 level, where BTC would hit a downtrend from recent highs.
How Low Can the BTC Price Go?
If this level was to also go, the door would then be opened to a potential drop towards resistance-turned-support in the $26,500 area, roughly in line with where the 50DMA also resides.
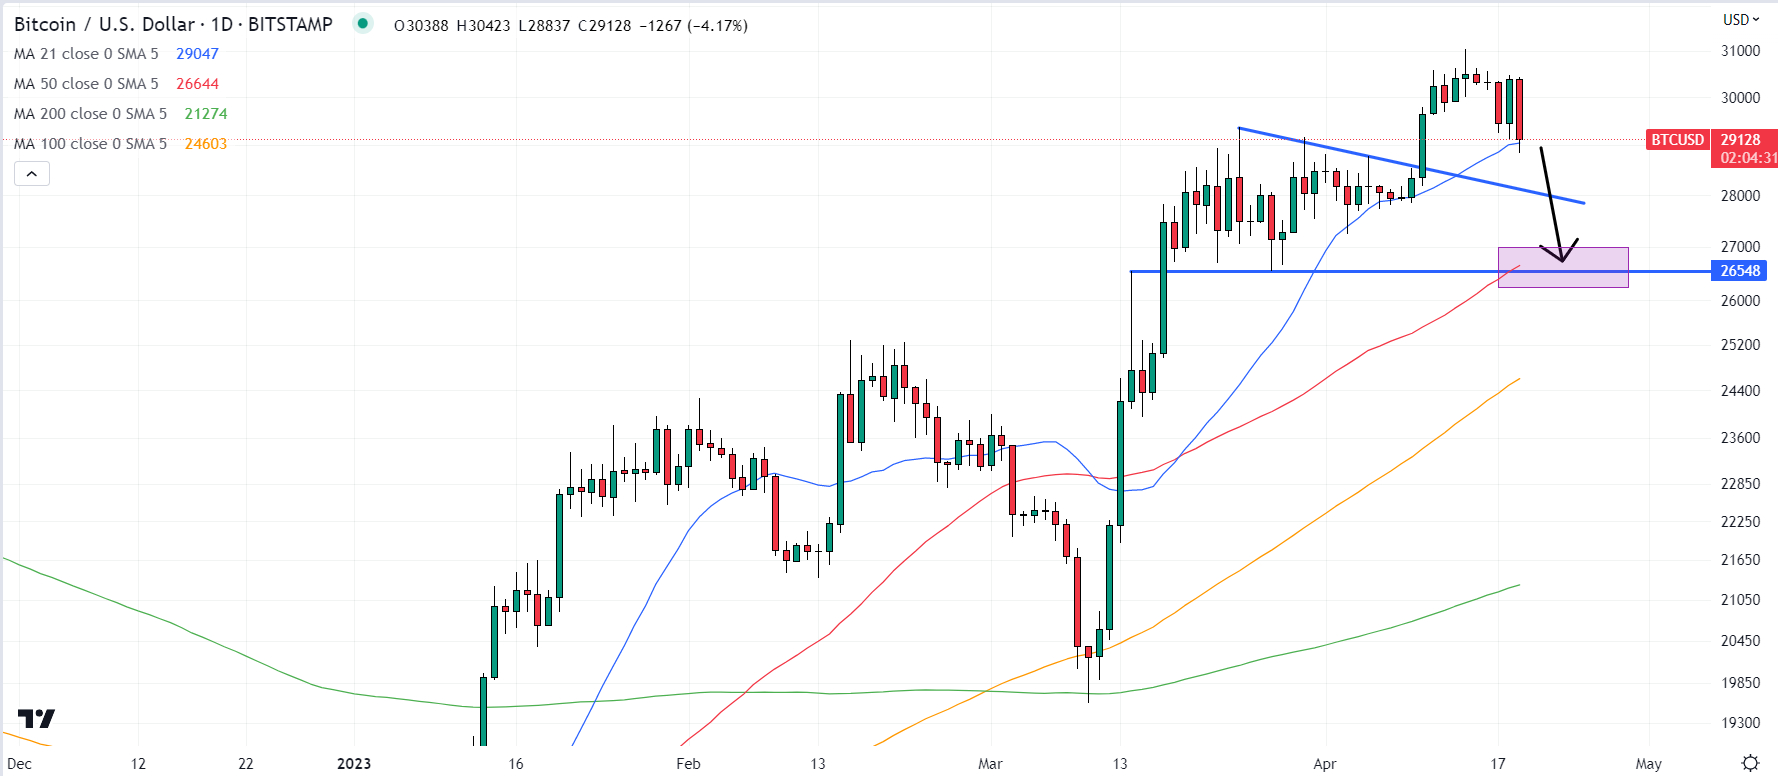
That would mark a drop of 8% from current levels.
Below that, the next major support zone is in the $25,200-400 region.
If Bitcoin was to drop back to the mid-$20,000s, this could mark a massive opportunity for bulls to add to long positions, or those who missed out on the March rebound from sub-$20,000 lows to get into the market.
That’s because, despite the ongoing risk of short-term volatility and swift 20% corrections (as seen in late February into March), Bitcoin has shown strong signs of being in the early stages of a new bull market.
Widely followed on-chain indicators are screaming such, as discussed in these prior articles.
Analysis of Bitcoin’s longer-term market cycles also suggests that, if history is anything to go by, last year’s lows in the $15,000s were the bottom of the last bear market, as discussed in this recent article.
Meanwhile, the macro backdrop looks set to become far more favorable for Bitcoin in 2023.
Yes, there might be one or two more interest rate hikes from the US Federal Reserve, but risks seem tilted towards a rate cutting cycle beginning in the later half of the year as the Fed deals with a (likely) oncoming recession.
Options Markets Relaxed About Downside Volatility Risks
For now, Bitcoin options markets seemingly remain sanguine on the risk of substantial further downside.
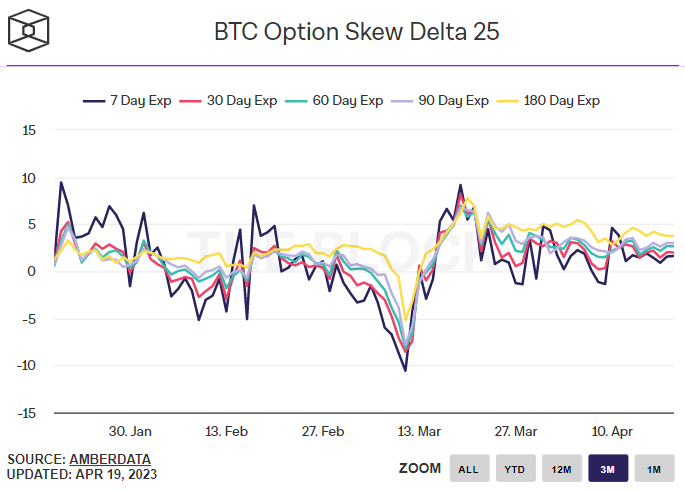
The 25% delta skew of Bitcoin options expiring in 7, 30, 60, 90 and 180 days all remain above zero, suggesting Bitcoin options investors continue to pay a premier for bullish call options over equivalent bearish put options, suggesting expectations remain tilted towards further upside rather than downside.
Bitcoin (BTC) is down sharply on Wednesday, with analysts citing a massive sell order on the world’s largest crypto exchange Binance and hotter-than-expected UK inflation data as weighing on the price action.
BTC/USD was last changing hands almost bang on the $29,000 level, nursing losses of around 4.5% on the day, putting the cryptocurrency on course for its worst one-day performance since the 9th of March.

Despite this, liquidations of leveraged long positions in Bitcoin futures remain relatively contained at just over $40 million, as per coinglass.

That’s not even the highest this month, suggesting the latest move lower hasn’t triggered much of a long squeeze.
For now, Bitcoin is managing to hold up above the key psychological level, as well as its 21-Day Moving Average just above it at $29,043.
Support in the form of the late March/early April highs in the $28,780-$29,380 area also seems to be keeping a floor under the price for now.

But a break below this key cloud of support could open the door to a quick drop to the $28,000 level, where BTC would hit a downtrend from recent highs.
How Low Can the BTC Price Go?
If this level was to also go, the door would then be opened to a potential drop towards resistance-turned-support in the $26,500 area, roughly in line with where the 50DMA also resides.

That would mark a drop of 8% from current levels.
Below that, the next major support zone is in the $25,200-400 region.

If Bitcoin was to drop back to the mid-$20,000s, this could mark a massive opportunity for bulls to add to long positions, or those who missed out on the March rebound from sub-$20,000 lows to get into the market.
That’s because, despite the ongoing risk of short-term volatility and swift 20% corrections (as seen in late February into March), Bitcoin has shown strong signs of being in the early stages of a new bull market.
Widely followed on-chain indicators are screaming such, as discussed in these prior articles.
Analysis of Bitcoin’s longer-term market cycles also suggests that, if history is anything to go by, last year’s lows in the $15,000s were the bottom of the last bear market, as discussed in this recent article.
Meanwhile, the macro backdrop looks set to become far more favorable for Bitcoin in 2023.
Yes, there might be one or two more interest rate hikes from the US Federal Reserve, but risks seem tilted towards a rate cutting cycle beginning in the later half of the year as the Fed deals with a (likely) oncoming recession.
Options Markets Relaxed About Downside Volatility Risks
For now, Bitcoin options markets seemingly remain sanguine on the risk of substantial further downside.

The 25% delta skew of Bitcoin options expiring in 7, 30, 60, 90 and 180 days all remain above zero, suggesting Bitcoin options investors continue to pay a premier for bullish call options over equivalent bearish put options, suggesting expectations remain tilted towards further upside rather than downside.
